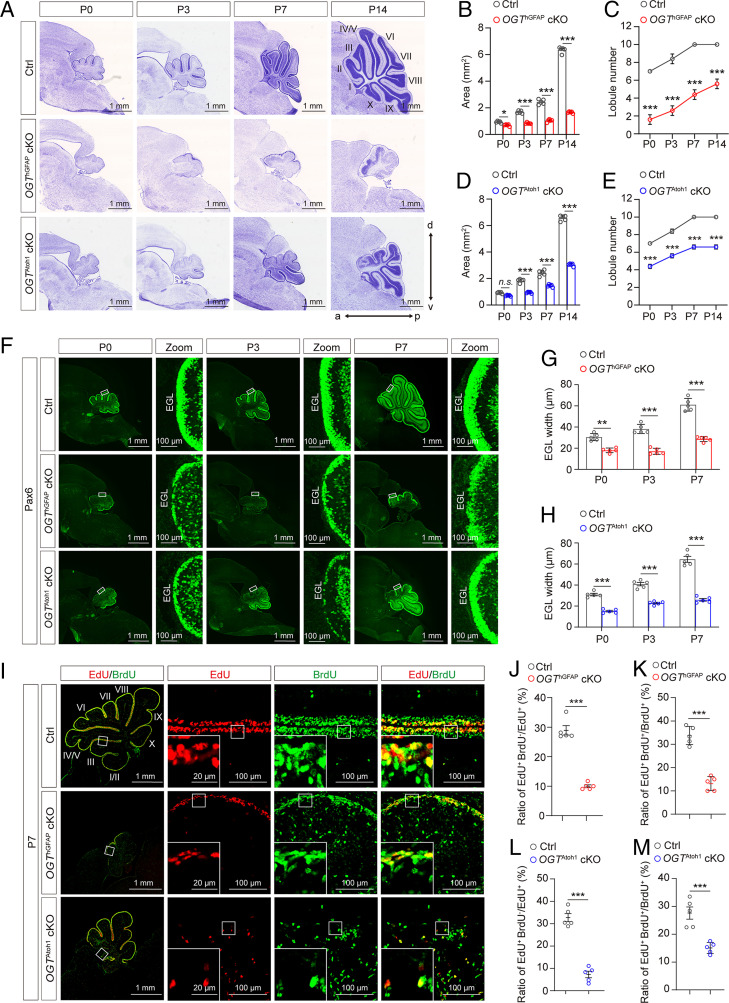
Fig. 1.
Loss of OGT in multipotent NSCs or GNPs impairs cerebellar morphogenesis. (A) Nissl staining of sagittal histological sections of the cerebellar vermis, showing considerable foliation defects in OGThGFAP cKO and OGTAtoh1cKO mutant mice at the indicated postnatal developmental stages. (Scale bars, 1 mm.) (B and C) Quantification of the area (B) and lobule number (C) of sagittal sections of the cerebellar vermis in Ctrl and OGThGFAP cKO mutant mice at indicated developmental stages (n = 5). Two-way ANOVA and Sidak’s multiple comparisons test. (D and E) Quantification of the area (D) and lobule number (E) of sagittal sections of the cerebellar vermis in Ctrl and OGTAtoh1 cKO mutant mice at indicated developmental stages (n = 5). Two-way ANOVA and Sidak’s multiple comparisons test. (F) Anti-Pax6 labeling of GNPs in sagittal sections of the vermis at the indicated postnatal developmental stages in Ctrl, OGThGFAP cKO, and OGTAtoh1 cKO mutant mice, respectively. (Scale bars, 1 mm and 100 μm.) (G and H) Quantification of EGL width in Ctrl, OGThGFAP cKO (G), and OGTAtoh1 cKO (H) mice at indicated postnatal stages (n = 5). Two-way ANOVA and Sidak’s multiple comparisons test. (I) Immunofluorescent staining of EdU (red) and BrdU (green) to assess GNP proliferation in the cerebellum of Ctrl, OGThGFAP cKO, and OGTAtoh1 cKO mice at P7. Mice were injected with BrdU at P6 and with EdU after 23 h. (Scale bars 100 μm.) Boxed areas are shown at higher magnification (Bottom Left corner) to illustrate EdU+BrdU+ cells remaining in the cell cycle. (Scale bar, 20 μm.) (J and K) Quantification of the ratio of EdU+BrdU− cells to the total number of EdU+ cells (J), or EdU+BrdU+ cells to the total number of BrdU+ cells (K) within the EGL, in the cerebellum of Ctrl and OGThGFAP cKO mice at P7, respectively (n = 5). Unpaired t test. (L and M) Quantification of the ratio of EdU+BrdU− cells to the total number of EdU+ cells (L), or EdU+BrdU+ cells to the total number of BrdU+ cells (M) within the EGL in the rostral cerebellum from Ctrl and OGTAtoh1 cKO mice at P7, respectively (n = 5). Unpaired t test. All data represent mean ± SEM, *P < 0.05, **P < 0.01, ***P < 0.001, n.s., no significance. a, anterior; d, dorsal; p, posterior; v, ventral. See also SI Appendix, Figs. S1–S4.

