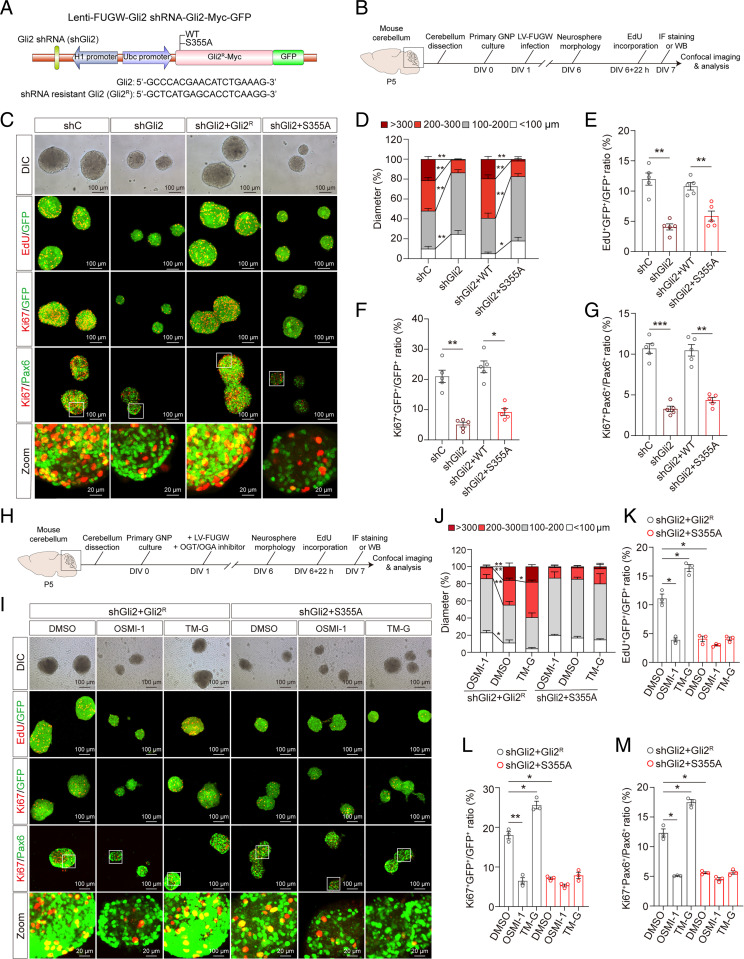
Fig. 4.
O-GlcNAc of Gli2 S355 promotes the proliferation of GNPs in vitro. (A) Schematic diagram of the Lenti-FUGW-Gli2 shRNA-Gli2-Myc-GFP plasmid with endogenous mouse Gli2 knockdown and overexpression of exogenous shRNA-resistant mouse Gli2 or Gli2 S355A mutant. Four constructs were utilized: shRNA control (shC), Gli2 shRNA knockdown (shGli2), Gli2 shRNA knockdown, and overexpression of shRNA-resistant mouse Gli2 (shGli2+Gli2R), or shRNA-resistant mouse Gli2 S355A mutant (shGli2+S355A). (B) Schematic diagram of experimental timeline and procedure for C–G. (C) Immunofluorescent staining with anti-EdU, anti-Ki67, and anti-Pax6 antibodies, overlayed on GFP+ or Pax6+ GNP neurospheres at day in vitro (DIV) 6. (Scale bars, 100 μm.) (D) The distribution of the diameter of GNP neurospheres at DIV6 (n = 4). Two-way ANOVA and Tukey’s multiple comparisons test. (E–G) Quantification of EdU+GFP+/GFP+ (E), Ki67+GFP+/GFP+ (F), and Ki67+Pax6+/Pax6+ (G) in GNP neurospheres at DIV6 (n = 5). One-way ANOVA and Dunnett’s multiple comparisons test. (H) Schematic diagram of experimental procedures for I–M. (I) Immunofluorescent staining with anti-EdU, anti-Ki67, and anti-Pax6 antibodies to label proliferating GNP neurospheres at DIV6. (Scale bars, 100 μm.) (J) The distribution of the diameter of GNP neurospheres infected with lentivirus and treated with OSMI-1 (10 μM) or TM-G (80 μM) at DIV6 (n = 3). Two-way ANOVA and Tukey’s multiple comparisons test. (K–M) Quantification of EdU+GFP+/GFP+ (K), Ki67+GFP+/GFP+ (L), and Ki67+Pax6+/Pax6+ (M) in GNP neurospheres at DIV6 (n = 3). One-way ANOVA and Dunnett’s multiple comparisons test. All data represent mean ± SEM *P < 0.05, **P < 0.01, ***P < 0.001. See also SI Appendix, Fig. S11.

