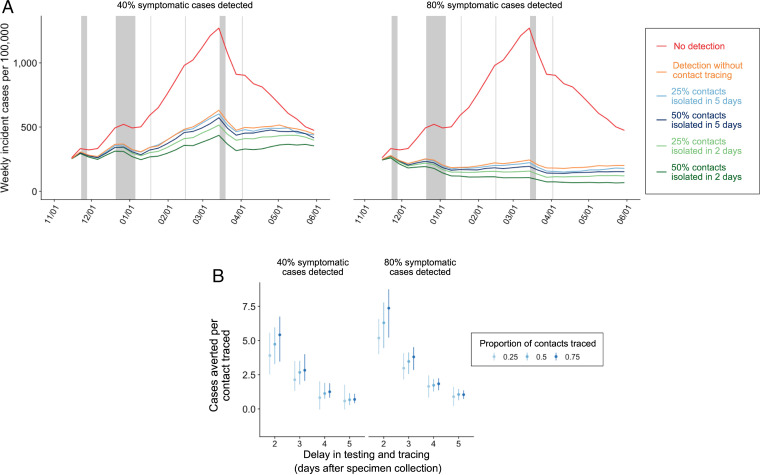
Fig. 3.
Expected COVID-19 incidence and cases averted per contact traced from November 8, 2020, to May 31, 2021, across a range of case detection and contact tracing scenarios, assuming R0 = 1.2. (A) Median estimated weekly incident COVID-19 cases across 200 stochastic simulations. Red curves correspond to the no testing or tracing scenario. Left and Right assume 40% and 80% of all symptomatics are detected and isolated, respectively. Orange curves correspond to testing without tracing, blue curves assume 25% or 50% of the contacts of the confirmed cases are traced and isolated 5 days after the isolation of the confirmed case, and green curves assume 25% or 50% of the contacts of the confirmed cases are traced and isolated after 2 days. The gray vertical shading represents Thanksgiving break, winter break, and spring break for the local school district, and the other vertical lines represent other school holidays including Martin Luther King Day, Presidents’ Day, and Easter (32). (B) Number of COVID-19 cases averted per contact successfully traced as a function of lag from specimen collection from the index case to isolation of the contact. Left and Right assume 40% and 80% of symptomatic cases are detected, respectively. The blue shading indicates contact tracing success rates of 25%, 50%, or 75%. The points are medians from 200 paired stochastic simulations, and the error bars are IQRs.

