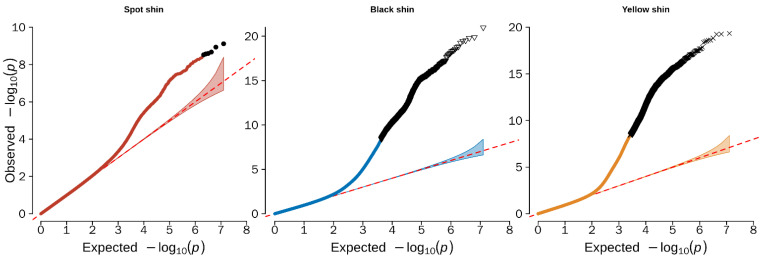
Figure 3.
Quantile–quantile (Q–Q) plots of the GWAS for the shin color trait in ducks. The Q–Q plots show the late separation between the observed and expected values. The red dotted lines indicate the null hypothesis of no true association. Deviation from the expected p-value distribution is evident only in the tail area for each color shin, indicating that population stratification was properly controlled.

