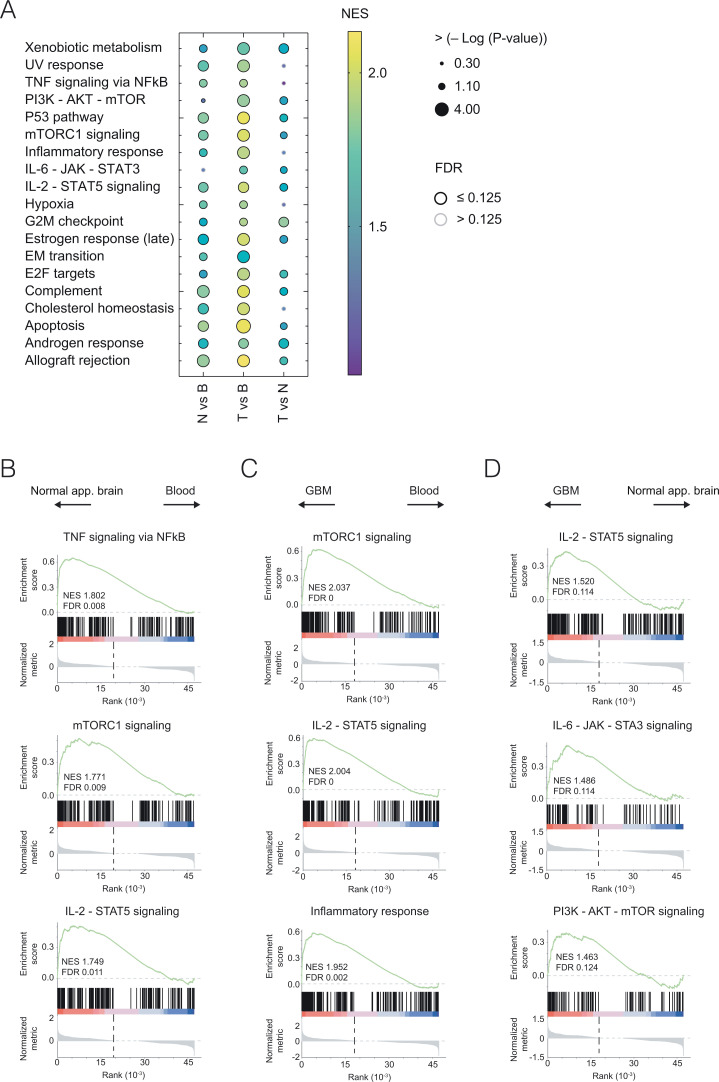
Fig. 5.
Transcriptome of CD4+ TILs is enriched for genes associated with TH17 hallmark molecular pathways. (A) Gene expression ratios of normal-appearing brain vs. blood CD4+ T cells (N vs. B), of GBM-residing CD4+ T cells vs. blood CD4+ T cells (T vs. B), and of GBM-residing CD4+ T cells vs. normal-appearing brain CD4+ T cells (T vs. N) were ranked and probed for the enrichment of known molecular hallmark pathway signatures (https://www.gsea-msigdb.org). NESs are color-coded. GSEAs with a false discovery rate (FDR) of ≤0.125 are indicated by black circles. Examples of GSEAs for the comparison of N vs. B (B), T vs. B (C), and T vs. N (D) are depicted. Note that several pathways, including but not limited to IL-6–JAK–STAT3 and PI3K–AKT–mTOR, were enriched in T vs. N, suggesting that the TME had an impact on the molecular imprinting of GBM-residing CD4+ T cells beyond the CNS-driven changes in the CD4+ T cell transcriptome.

