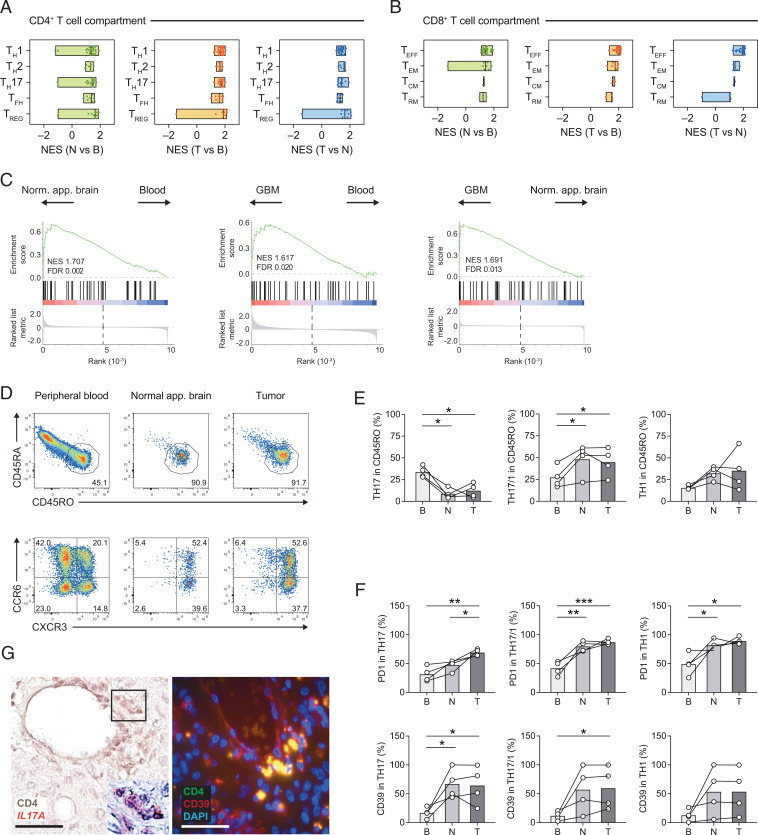
Fig. 6.
CD4+ TILs develop a robust TH17 cell signature. (A and B) Pairwise compared gene expression between two anatomical compartments was tested for enrichment of curated gene signatures for CD4+ TILs (TH1, TH2, TH17, TFH, and TREG cell signatures) (A) and CD8+ TILs (TEFF, TEM, TCM, and TRM signatures) (B); see Materials and Methods for details. The minimum and maximum NESs as well as the median for each canonical signature are depicted. (C) GSEA of a published AHR signature of human CD4+ T cells (23) based on the ranked fold changes for the indicated pairwise comparisons. NESs and FDRs are indicated in each enrichment plot. (D–F) Flow cytometric analysis of CD4+ T cells isolated from blood, normal-appearing brain, and GBM tissue. (D) Activated T cells were gated based on CD45RO expression and subclassified into T helper cell subsets according to the expression of distinct chemokine receptors: TH17 cells (CCR6+CXCR3–), TH17/1 cells (CCR6+CXCR3+), and TH1 cells (CCR6–CXCR3+). (E) Fraction of TH17, TH17/1, and TH1 cells among CD4+CD45RO+ activated/memory T cells in tissue compartments as indicated (B, blood; N, normal-appearing brain; T, GBM [tumor] site). (F) Flow cytometric assessment of PD1 and CD39 in TH17, TH17/1, and TH1 cells in the tissue compartments as indicated. One-way ANOVA (repeated-measures) with Tukey post test, *P < 0.05, **P < 0.003, ***P < 0.0003. (G) IL17A messenger RNA detection (by RNAscope) in CD4+ T cells (frame, magnified region with CD4+ T cells showing punctate IL17A signals; Left) and immunofluorescence staining for CD4 (green) and CD39 (red) (merge: yellow) at the GBM site (Right). (Scale bars, 50 μm.)

