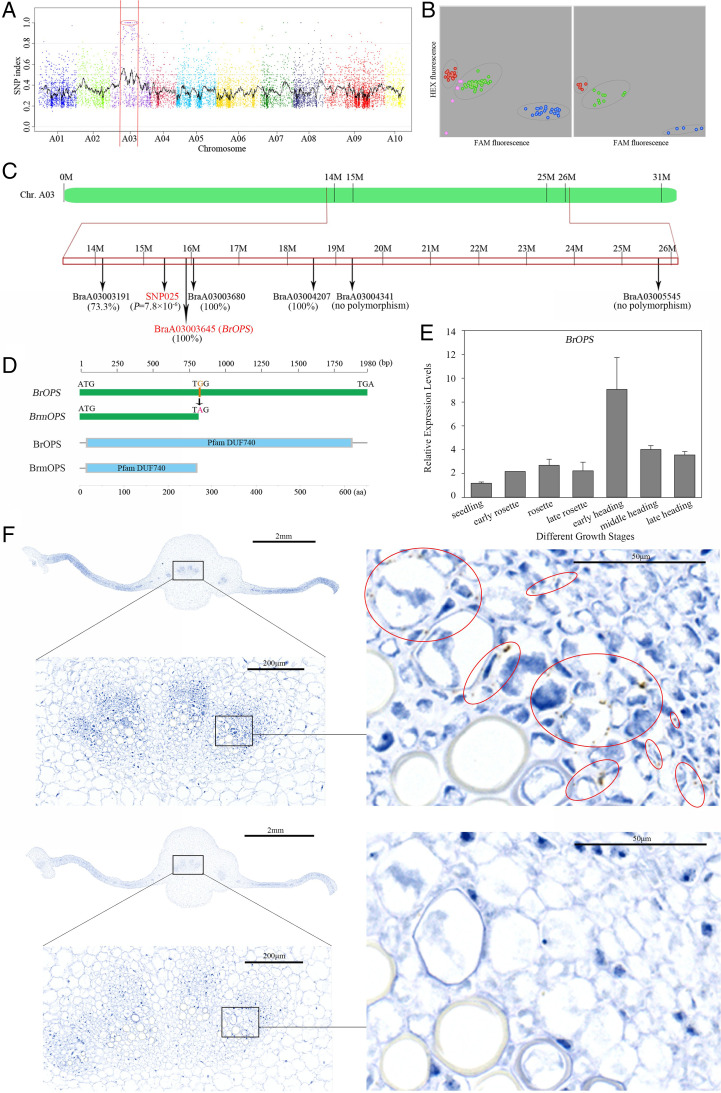
Fig. 2.
Identification of candidate loci for ic1. (A) Identification of genomic regions harboring causal mutations for ic1 using MutMap. SNP index plots for ic1 showing 10 chromosomes. Each symbol corresponds to an SNP, and the x-axis corresponds to the chromosomal position. The black regression line is the average value of the SNP index based on a sliding window analysis. SNPs on chromosome A03 marked by a red circle between two red lines are the predicted causal mutations for ic1. (B) Kompetitive Allele Specific PCR (KASP) genotyping assay using SNP markers in the mutant gene loci identified from MutMap in an F2 (WT × ic1) population of 96 individuals (left) and in 5 F2 (WT × ic1) individuals, 2 WT plants, 2 ic1 lines, and 2 F1 lines (right). Red, mutant (ic1); green, heterozygous; blue, WT. pink, unknown. (C) The chromosomal positions of six mutant genes identified via MutMap. The key gene BraA03003645 (BrOPS) is labeled in red. SNP (SNP025), highlighted in red, was identified as closely associated with leafy head type in the results of target SNP and SSR-seq. The correlation values with leafy head type are indicated in parentheses beneath the SNP or gene. (D) Schematic diagram of the WT (BrOPS) and mutant (BrmOPS) OPS genes and their encoded proteins (BrOPS and BrmOPS). (E) The expression pattern of BrOPS at seven different growth stages. Error bars, SD (n = 3). (F) The tissue locations of BrOPS detected via RNAscope ISH at the early heading stage. The brown dots inside the red circles indicate BrOPS. The bottom is BrOPS expression detected using the sense probe of BrOPS as a negative control. FAM, 6-carboxy-fluorescein; HEX, hexachlorofluorescein.

