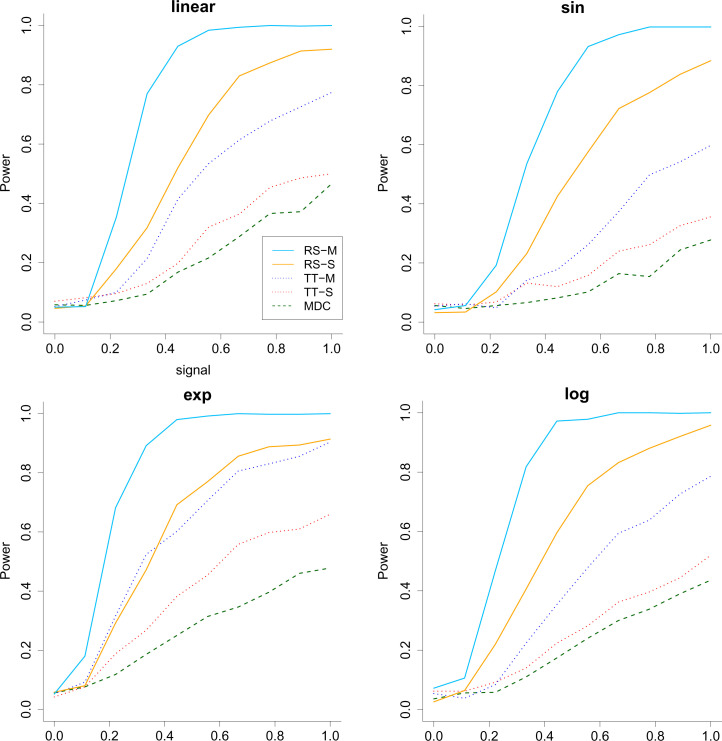
Fig. 1.
The power (vertical) versus signal (horizontal) for the all the methods when the response has heavy-tailed distribution and . The RS stands for rank-sum test, and TT stands for two-sample t test. M means multiple split, and S represents a single split. Across the 4 panels, the relationship between Y and the first covariate is linear, sine (sin), exponential (exp) and logarithmic (log).

