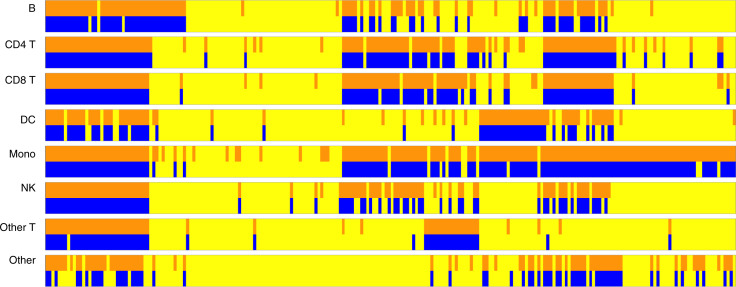
Fig. 3.
The predictability test of every protein across all cell types. The columns represent the 226 proteins, and the row blocks represent the eight different cell types. In each cell type, the first row represents X being all 5,000 genes, and the second row represents X being the marker genes under the testing problem [2]. The orange bars and blue bars represent the tests rejecting H0, and the yellow bars represent the tests failing to reject H0.

