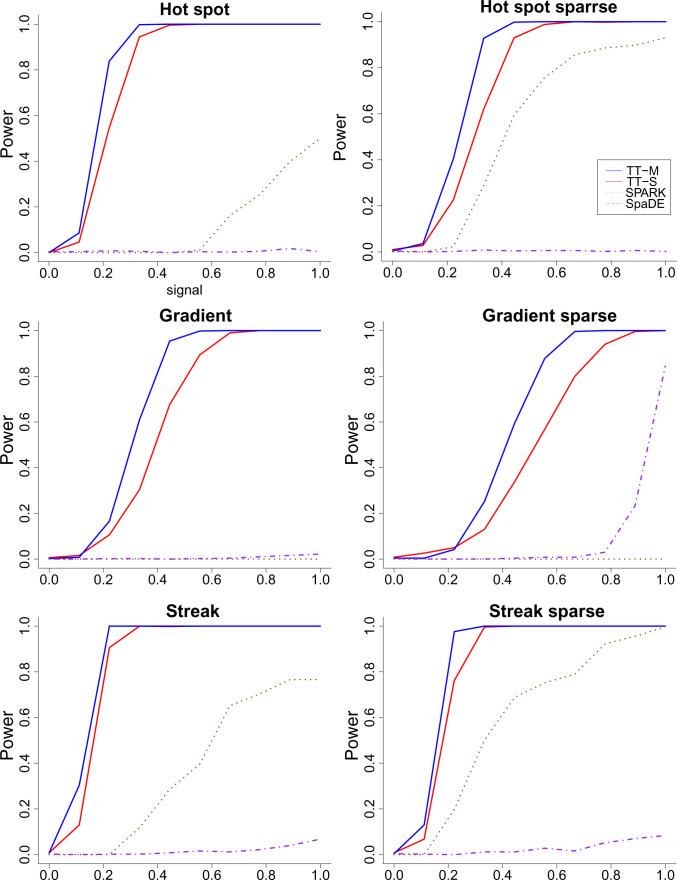
Fig. 6.
The power (vertical) versus signal (horizontal) for the regression-based two-sample t test, SPARK, and SpaDE when . (Top) Hot spot, (Middle) gradient, and (Bottom) streak patterns. (Left) Nonsparse and (Right) sparse settings. Across the 6 panels, the spatial patterns are as indicated in the main heading. Details provided in SI Appendix.

