Fig. 10.
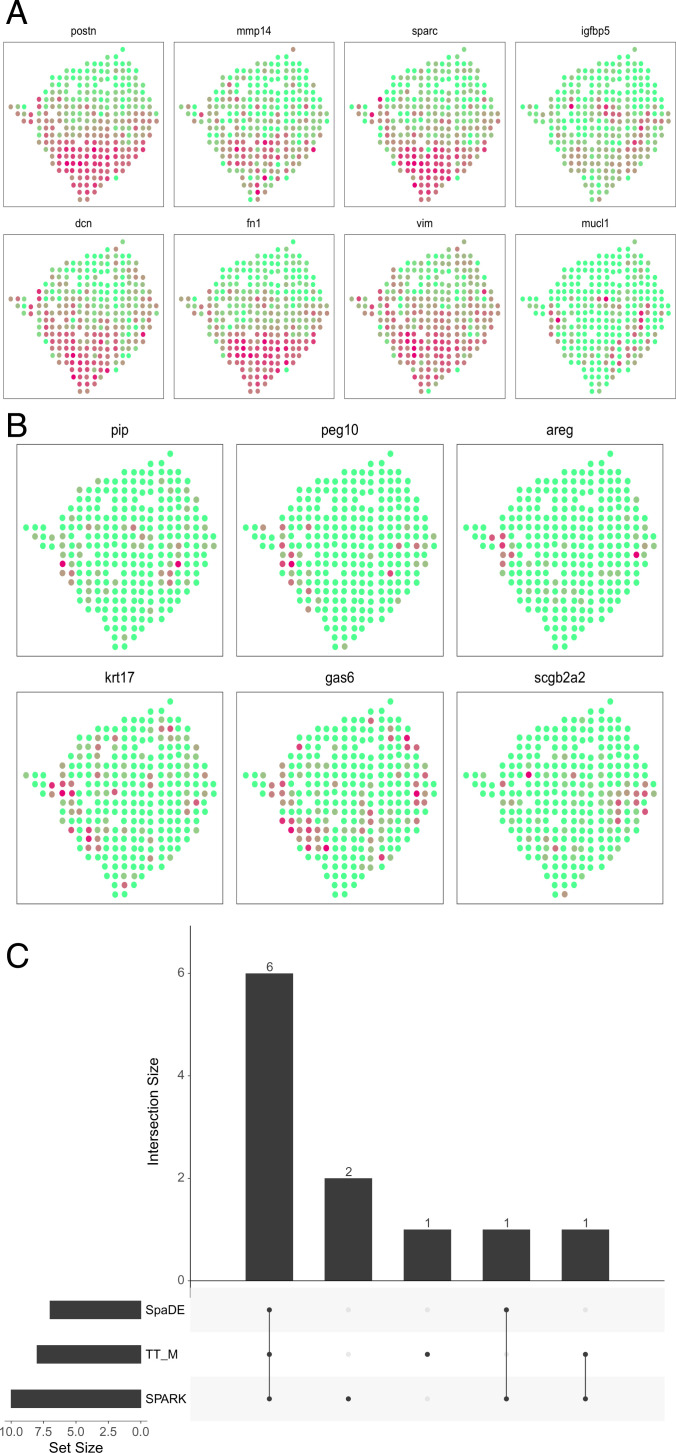
Analysis of the cancer genes. (A) The 8 cancer genes that are detected by the proposed method as the SVGs among the 14 cancer genes highlighted in ref. 24. (B) The other six cancer genes that are missed by the proposed method. (C) The upset plot shows the overlap of the cancer genes for all three methods.

