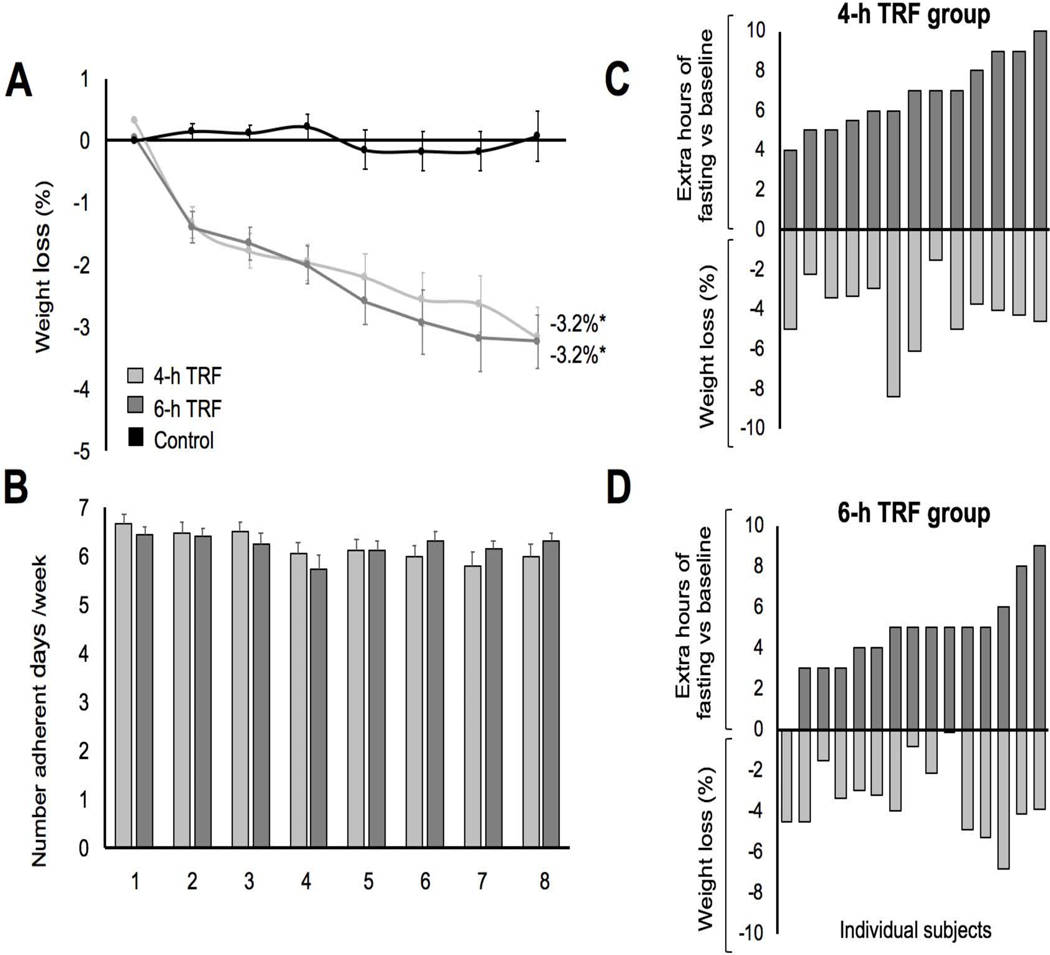
Figure 3. Weight loss and diet compliance.
(A) Percentage weight loss vs baseline for the 4-h TRF, 6-h TRF group and Ad lib control group during the 8-week intervention period of the study. Each data point represents each week of the 8-week period, starting at week 1.
(B) The number of adherent days of the dietary regimen for the 4-h (light grey) and 8- hr (dark grey) TRF groups over the 8-week intervention period of the study.
(C) The extent of the fasting window and the percentage weight loss in the 4-h TRF group. Completers only analysis.
(D) The extent of the fasting window and the percentage weight loss in the 6-h TRF group. Completers only analysis.
Values reported as mean ± SEM, where appropriate. Data were included for 58 participants; means were estimated by an intention-to-treat analysis using last observation carried forward. *P < 0.001, change score between baseline to week 8 by ANCOVA.

