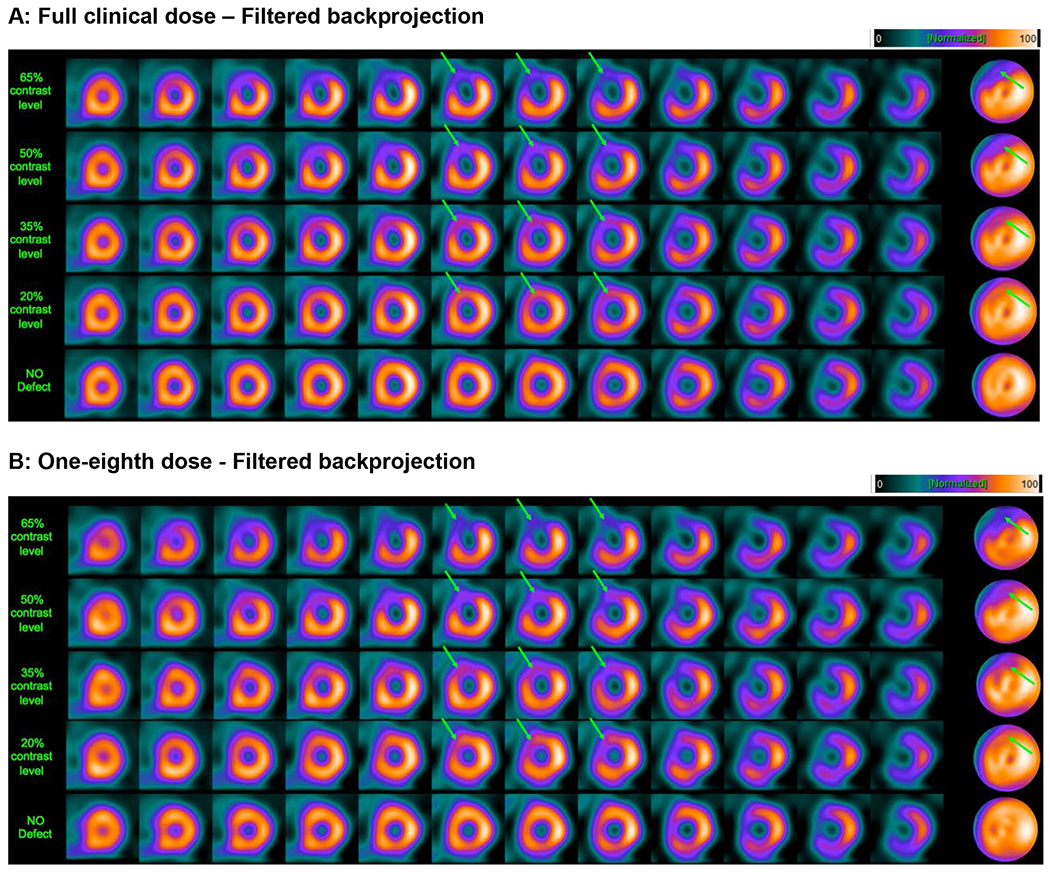
Figure 1.

Example short-axis slices and polar maps, obtained by filtered backprojection, for a 55-year-old female patient with a body-mass index (BMI) of 33.3 from a clinical study, with a large, simulated defect introduced in the LAD territory. Arrows indicate the defect location. Panels A and B show short-axis image slices and polar maps for a clinical scan (no defect; bottom row) and for four levels of defect contrast (20%, 35%, 50%, and 65%). The images in Panel A were obtained from full clinical dose, while the images in Panel B are at a simulated dose level that is one-eighth (12.5%) of clinical dose. The images were obtained by optimizing the reconstruction parameters for the particular dose level. This figure illustrates that image quality can be preserved at reduced dose by optimizing the reconstruction parameters (in this case, the cutoff frequency of the smoothing filter).
