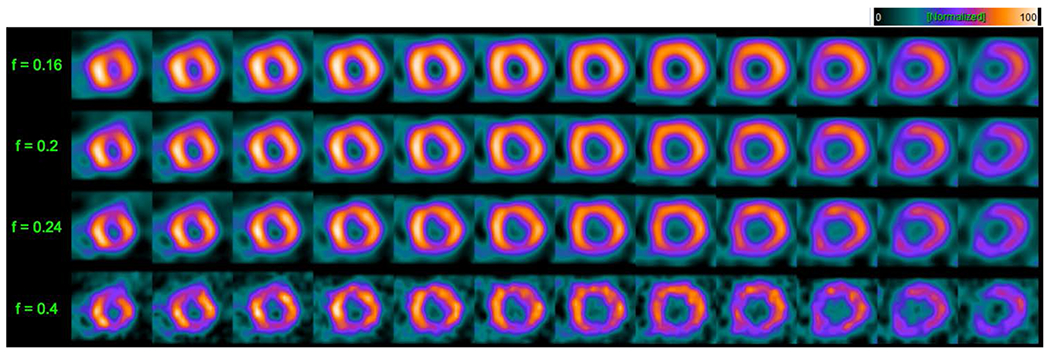
Figure 4.

Short-axis slices at the 100% dose level for FBP reconstruction illustrating the impact of variation in cutoff frequency of the 2D pre-reconstruction Butterworth filter for a 49-year-old female patient with a BMI of 30 whose study was interpreted as normal. Cutoff frequency values are shown along the left of the figure. Notice the definite increase in noise and perfusion detail in the slices as the cutoff frequency increases, illustrating the need for optimization of this parameter before comparing AUC’s between dose levels and reconstruction strategies.
