
Figure 5.
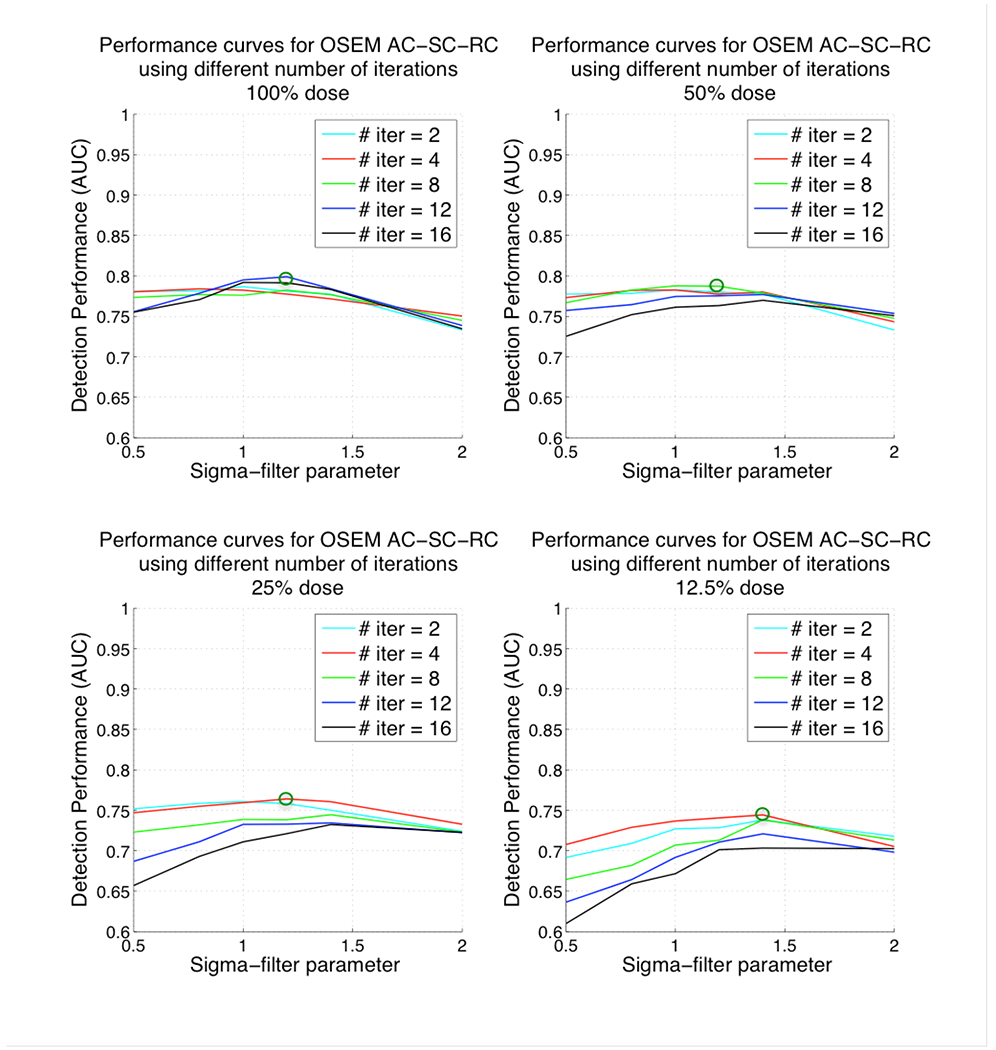
Plots of AUC versus 3D post-reconstruction Gaussian filter parameter and number of iterations for ordered-subsets expectation-maximization (OS-EM) algorithm with attenuation, scatter and resolution correction (AC-SC-RC) for different dose levels. Top-left corresponding to 100% administered dose, top-right 50% administered dose, bottom-left 25% administered dose and bottom-right 12.5% administered dose. Note that lower values for the filter parameter result in reconstructed images that are noisier (less smoothed) and higher values result in smoother images.