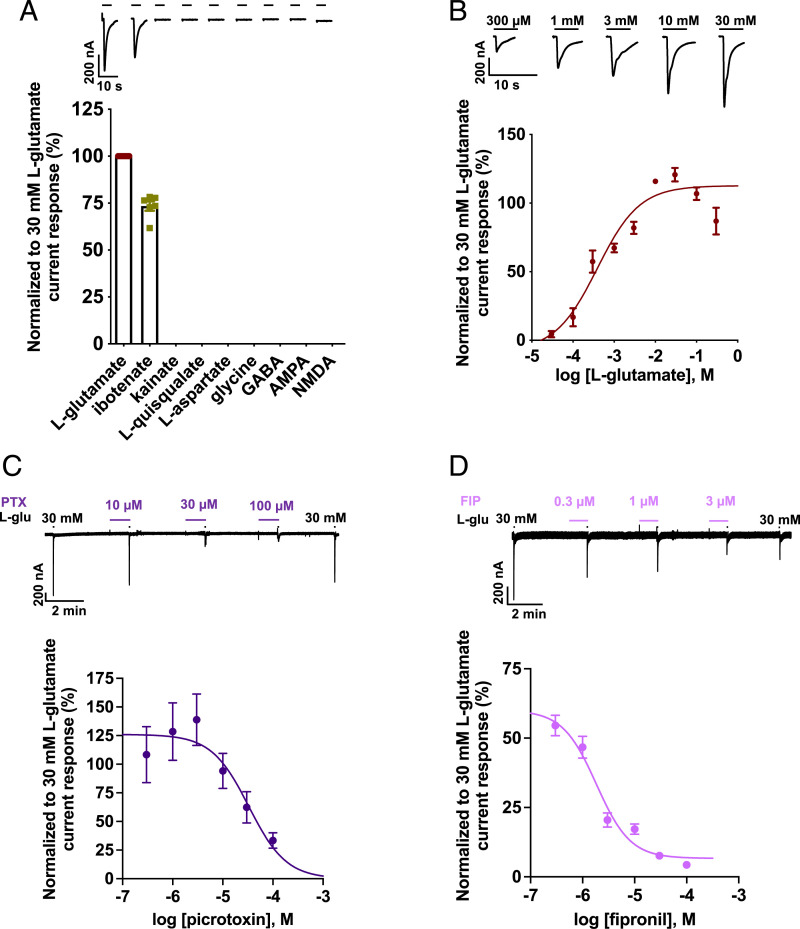
Fig. 3.
Pharmacology of B. malayi AVR-14B. (A) Representative traces (Top) for agonist responses and bar chart (Bottom) showing mean ± SEM, %, for normalized current responses to the different agonists tested at 1 mM. Rank order series: L-glutamate (100 ± 0.0, n = 13) > ibotenate (73.4 ± 2.5, n = 6) ⋙ kainate (n = 6) = L-quisqualate (n = 6) = L-aspartate (n = 7) = glycine (n = 7) = GABA (n = 7) = AMPA (n = 7) = NMDA (n = 7). (B) Representative inward current traces and concentration-response plot for L-glutamate (n ≥ 5). L-glutamate produced an EC50 = 0.4 mM (pEC50 of 3.4 ± 0.2) and nH = 0.8 ± 0.3. (C) Representative trace (Top) and concentration-inhibition curve (Bottom) for L-glutamate (L-glu)–mediated response in the presence of PTX (n = 5). The IC50 and nH values were 33.1 µM (pIC50 = 4.5 ± 0.2) and −1.2 ± 0.6. (D) Representative trace (Top) and concentration-inhibition curve (Bottom) for L-glutamate–mediated response in the presence of FIP (n = 5). The IC50 and nH values were 1.8 µM (pIC50 = 5.7 ± 0.1) and −1.3 ± 0.4. L-glu, L-glutamate. Error bars in A–D represent SEM.

