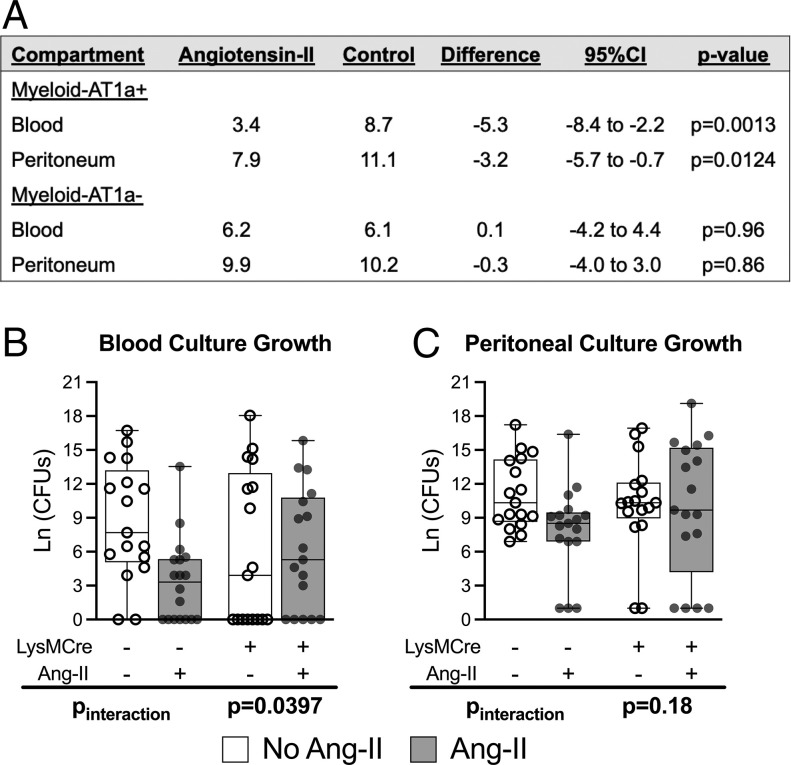
Fig. 3.
AT1R deletion from myeloid-lineage leukocytes reverses the effect of angiotensin-II treatment to reduce blood culture growth 24 h post-CLP. (A–C) Bacterial counts by treatment and genotype. LysMCre+ and LysMCre− designate the Myeloid-AT1a− and Myeloid-AT1a+ genotypes, respectively. The y axis displays bacterial counts on a natural log scale. Dots represent individual mice, horizontal bars indicate the group median, box height represents the interquartile range, error bars represent the range. The Pinteraction indicates the interaction effect P value for the difference-in-difference: That is, a significant interaction effect indicates the difference between angiotensin-II treated and untreated mice within the Myeloid-AT1a− group is significantly different from the difference between treated and untreated mice in the Myeloid-AT1a+ group.

