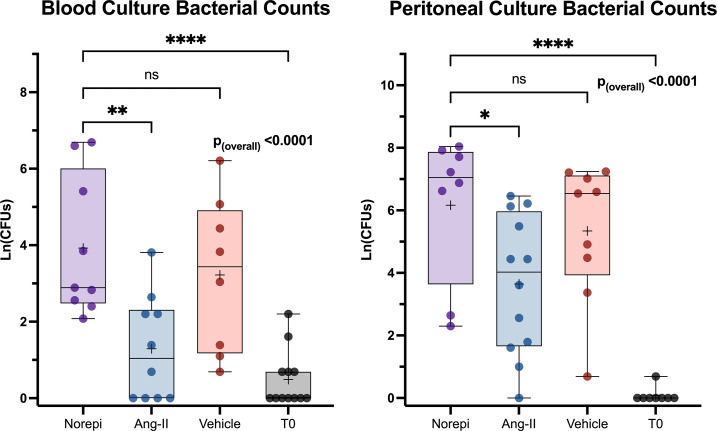
Fig. 5.
Peritoneal and blood culture growth is decreased with angiotensin-II treatment but not norepinephrine treatment 48 h after CLP. Bacterial counts in treatment groups and T0 mice. The y axis displays bacterial counts on a natural log scale. Dots represent individual mice. Box height represents interquartile range, error bars represent range. Asterisks indicate the (multiple comparison adjusted) P values vs. the norepinephrine group at the indicated time point as follows: ns, P > 0.05; *P < 0.05; **P < 0.005; ****P < 0.0001. Norepi, Norepinephrine.

