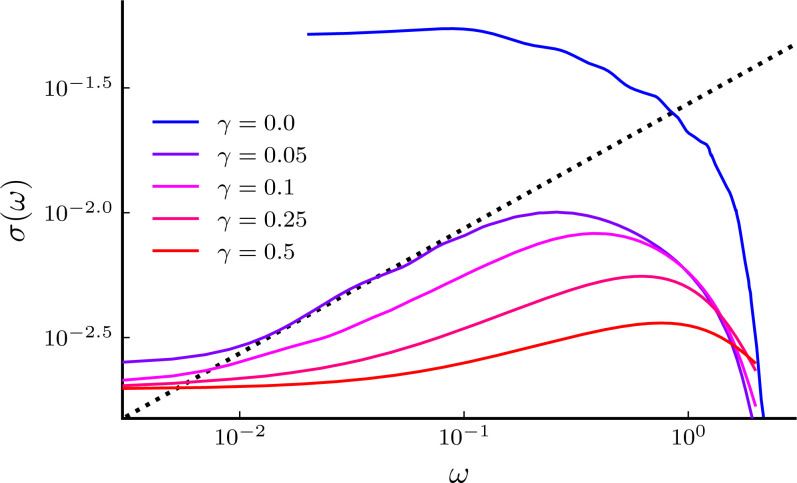
Fig. 2.
Low-frequency spin conductivity in the noisy XXZ chain. Plot of obtained from MPO simulations at Δ = 12 and for various values of the noise strengths γ. The dashed line corresponds to the predicted intermediate subdiffusive behavior . Note that the plot starts at , and data for are expected to converge to lower values at smaller ω. Moreover, the spectral weights are also redistributed by the noise at higher frequencies (not shown in this plot).

