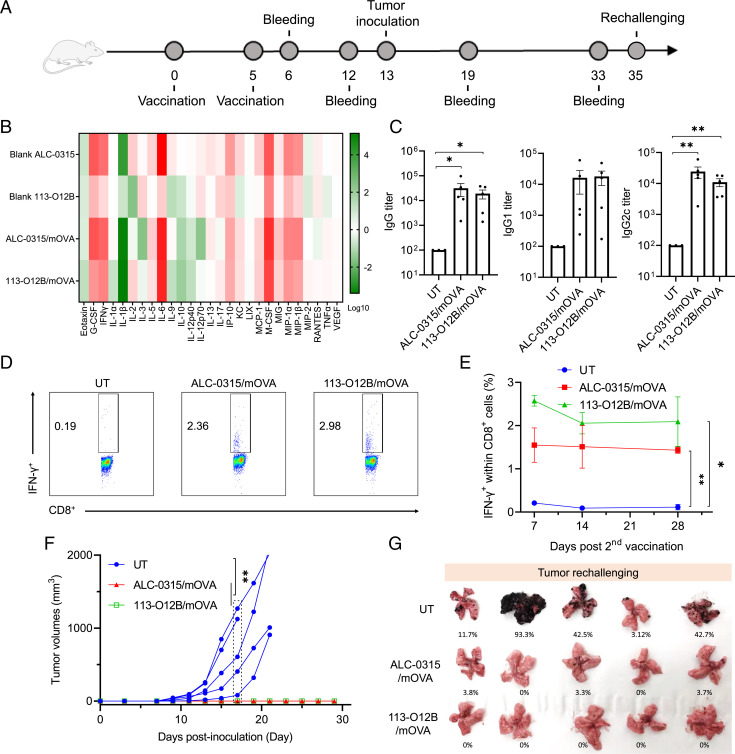
Fig. 2.
T cell response and protective effect after vaccination. (A) Timeline for vaccination and blood withdrawal. (B) Changes of cytokines and chemokines in the mice treated by blank or OVA mRNA-formulated LNPs for 24 h. (C) OVA-specific antibody titers in the mice treated by 113-O12B/mOVA and ALC-0315/mOVA on day 12. (D) Representative flow cytometry diagrams of IFN-γ-positive cells within CD3+ CD8+ T cells 7 d after second vaccination. (E) Time-dependent changes of IFN-γ-positive cells 7, 14, and 28 d after second vaccination. (F) Tumor volumes of B16F10-OVA tumor model. (G) Lungs collected 18 d after the intravenous injection of B16F10-OVA cells. UT: Untreteated. The error bar around each data point is the SD. Tukey's multiple comparisons test was used to calculate the statistical significance. *P < 0.05 was considered statistically significant. **P < 0.01 and ***P < 0.001 were considered highly significant.

