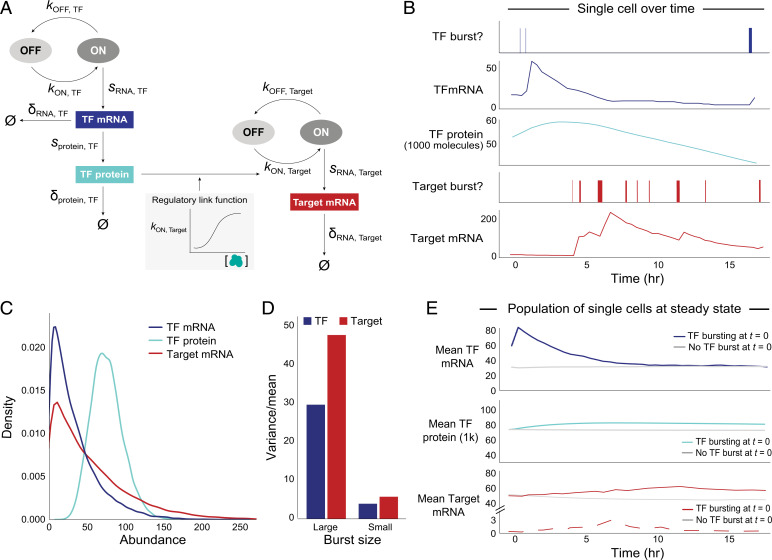
Fig. 2.
Transcriptional bursting yields intrinsic variation for each gene across cells at steady state. (A) Two-state model of transcriptional bursting and regulation for one Regulator–Target pair. Variables: kON (burst frequency), kOFF (1/burst duration), sRNA (transcription = burst size*kOFF), sprotein (translation), δ (decay), Ø (no molecules left). Blue: TF, red: Target. (B) Simulation of TF(RNA), TF(P), and Target(RNA) bursting events and abundance for one cell in the presence of direct regulation between a pair of genes. (C) Abundance distributions of TF(RNA) (μ: 29, CV: 0.84), TF(P) in thousands (μ: 61, CV: 0.31), and Target(RNA) (μ: 50, CV: 0.93), for median values of burst parameters, across 20,000 simulated cells. (D) Overdispersion structure (variance/mean) of total mRNA for TF and Target for different burst sizes (large TF: 32 transcripts/burst, large Target: 40 transcripts/burst; small TF: 3, small Target: 4). (E) Mean TF(RNA) (Top), TF(P) (Middle), and Target(RNA) (Bottom) abundance over time, across cells that did have a burst of the TF gene (colored, n = 715) versus those that did not have a burst (gray, n = 715 randomly subsampled cells with no burst) at t = 0 (20,000 total cells). Solid red line indicates TF(RNA) and dashed red line indicates TF(ΔRNA). Curves are based on data points at 30 min intervals. (TF mRNA at 30 min shows a sharp peak due to discrete sampling; the actual peak is smooth.)

