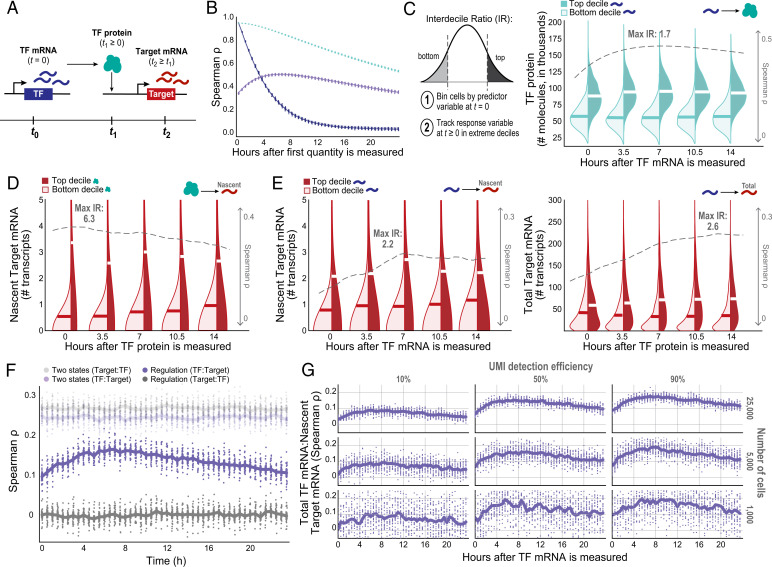
Fig. 3.
Information flow between a TF and its target gene is time-dependent. (A) Schematic of the multistep inference question. (B) TF(RNA) and TF(P) Spearman’s ρ autocorrelations and correlations between TF(RNA) and TF(P) over time, across 25 simulation runs (each included as its own dot). (C–E) Kernel density estimates comparing the extremes of distributions across cells at t ≥ 0, binned by the predictor molecule abundance at t = 0. Dashed gray line indicates Spearman’s ρ, and “max IR” indicates maximum D10:D1 IR between top- and bottom-binned cells (alternative hypothesis: top decile of the dependent variable is greater than the bottom decile) value at each time point, with the highest magnitude effect listed. (C) TF(RNA)0:TF(P)T correlation and D10:D1 IR of TF(P) distribution extremes at t ≥ 0 for cells binned by TF(RNA) at t = 0. (D) TF(P)0:Target(kon)T correlation and D10:D1 IR of adjusted Target(ΔRNA) distribution extremes for cells binned by TF(P) at t = 0, under the Hill function model of interaction. (E) Relying on mRNA only—CTΔ and TF(RNA)-binned Target(ΔRNA) D10:D1 IR (Left) and CT and Target(RNA) D10:D1 IR (Right)—to infer regulation over time. (F) Correlation between a TF and its putative Target could be a result of cell-state-based structure; if so, the time-shifted correlation would have a stable magnitude over time. (G) Effect of down-sampling the number of cells and/or UMI detection efficiency on estimated TF:Target covariation trends over time (focusing on CTΔ). Estimates get both noisier and lower in magnitude due to these two technical considerations.

