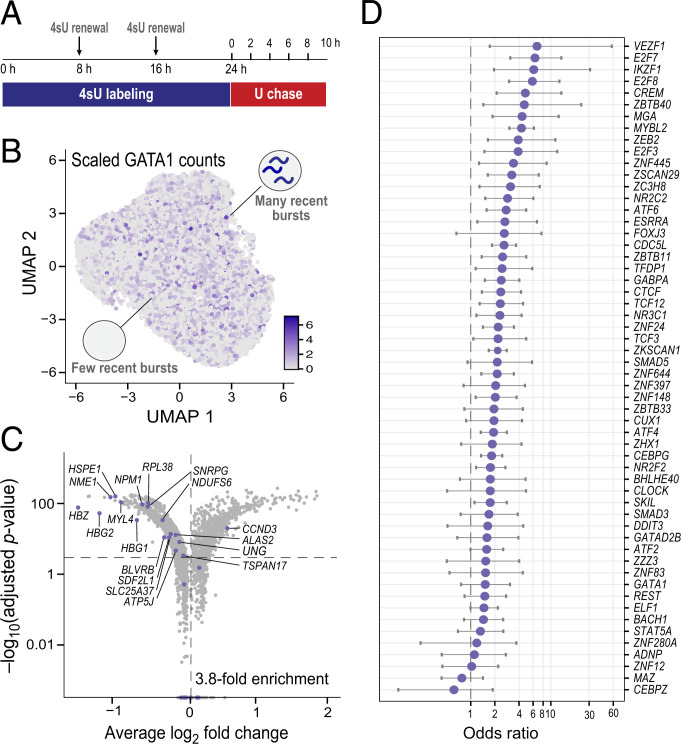
Fig. 4.
Enrichment of gene regulatory signal from simultaneous correlations in scRNA-seq data of K562 cells at steady state. (A) Schematic of the experimental design of a pulse–chase metabolic labeling experiment to capture two temporally resolved snapshots of RNA abundance in the same single cells. U, uridine. (B) UMAP of 13,679 unperturbed K562 single cells across six time points (∼1,000 to 4,000 cells per time point), colored by GATA1 scaled counts. (C) Differentially expressed genes upon GATA1 knockdown, inferred from an orthogonal GATA1 knockdown Perturb-seq experiment in K562 cells (92). The horizontal dotted line represents a Bonferroni-adjusted P value threshold of 0.001, and the vertical one a log2 fold change of 0. Purple dots denote the set of correlated genes with P < 0.05 at all time points, which have a 3.8-fold enrichment. (D) Enrichment of predicted TF binding from simultaneous Corr(TF(RNA)T:non-TF(RNA)T) correlations for ChIP-seq binding signal across 56 TFs with ENCODE ChIP-seq data that have at least 15 significantly correlated genes from the K562 data.

