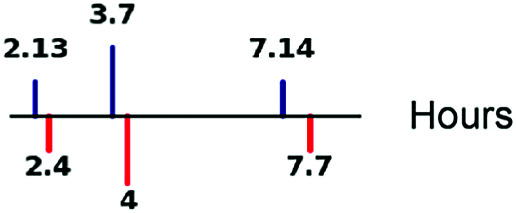
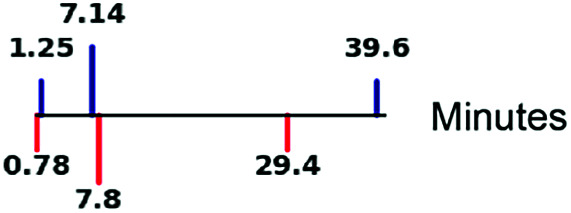
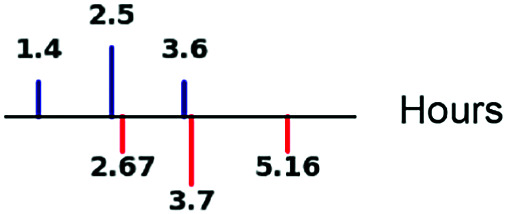
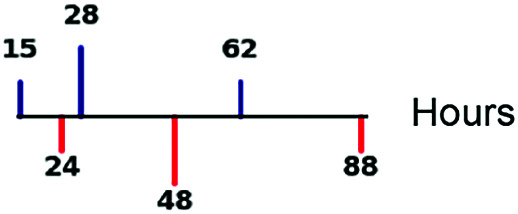
Table 1.
Range of intrinsic parameter values for TFs and non-TF genes
| Parameter | Interquartile ranges
|
Refs. |
|---|---|---|
| Time between bursts (1/kON) |

|
67, 70 |
| Burst duration (1/kOFF) |

|
67, 70 |
| mRNA half-life |

|
65, 69, 81 |
| Protein half-life |

|
69 |
| Burst size |

|
55, 67, 74 |
| Translation rate |

|
65, 69 |
Derived from literature, where parameters were estimated and inferred from published experimental data. Lines represent first quartile, median, and third quartile values for TFs (blue) and non-TFs (red), respectively. Burst sizes used in simulations were based on previously published smFISH-based copy numbers, although we note that scRNA-seq data-based estimates are lower due to transcript capture inefficiencies (88–90). kon = burst frequency; koff = number of burst ends per hour.
