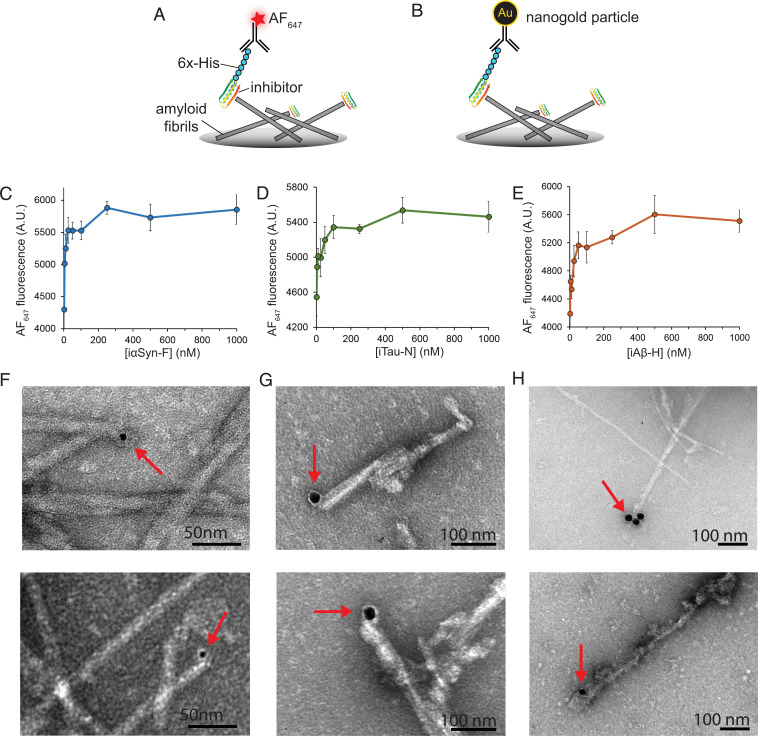
Fig. 4.
Binding of designed inhibitors to target amyloid fibrils. (A) ELISA binding assays were used to measure inhibitor binding to fibril ends. Inhibitors with uncleaved His-tags were incubated with fibril-coated plates, then labeled with an AF647-conjugated anti-His primary antibody. Fluorescence measurements at different concentrations of inhibitor (iTau-N shown) illustrate binding saturation in the high nanomolar regime. (B) To visualize the designed miniproteins bound to the fibril ends, inhibitors were incubated with fibrils, then labeled with 5 or 20 nm gold nanoparticles (indicated by red arrows), demonstrating a binding mode consistent with their intended design. (C–E) ELISA binding curves of iαSyn-F to αSyn fibrils (C), iTau-N to tau k18+ fibrils seeded with AD brain-derived fibrils (D), and iAβ-H to Aβ1–42 fibrils (E). (F–H) Transmission electron micrographs of amyloid fibrils bound with miniprotein inhibitors labeled with gold nanoparticles. (F) iαSyn-E bound to αSyn fibrils. (G) iTau-N bound to tau k18+ fibrils seeded with AD brain-derived fibrils. (H) iAβ-H bound to Aβ1–42 fibrils. In all three samples, inhibitors are observed binding primarily to the tips of the fibrils, consistent with their intended design. Additional TEM images are available in SI Appendix, Fig. 5.

