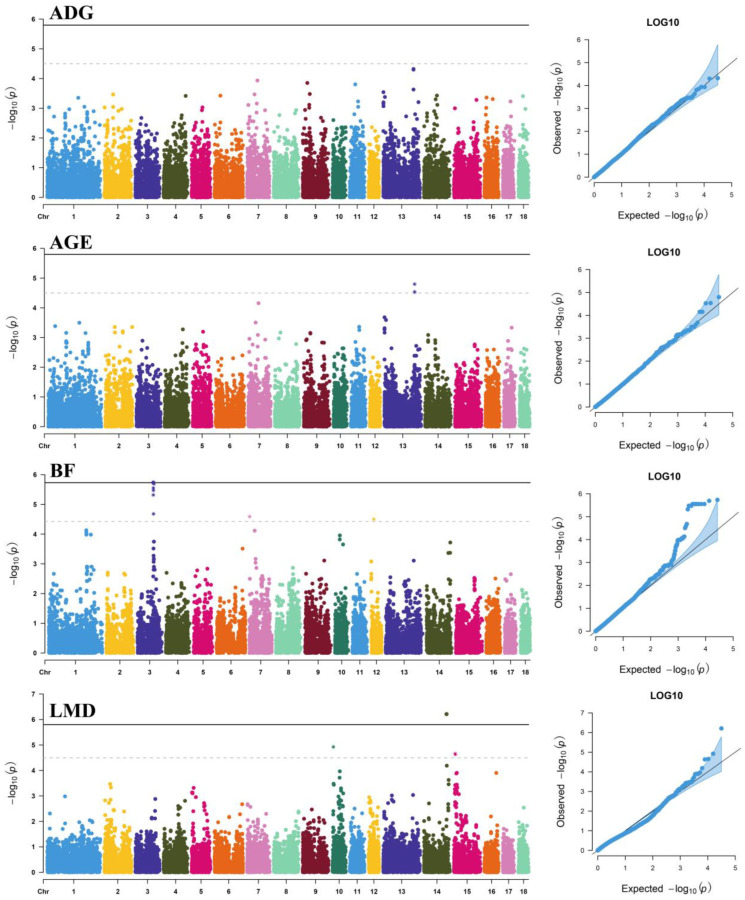
Figure 2.
Manhattan plots and Q-Q plots of SNP dominance effects for average daily gain (ADG), adjusted age at 100 kg (AGE), backfat thickness at 100 kg (BF), and loin muscle depth at 100 kg (LMD) traits. The X-axis shows the physical position of SNPs on each chromosome; the Y-axis shows the significance levels (−log10 p-values). The solid line indicates genome-wide significance (p < 1.59 × 10⁻⁶); the dashed line shows suggestive significance (p < 3.19 × 10⁻⁵). The Q-Q plots show the observed vs. expected log p-values.

