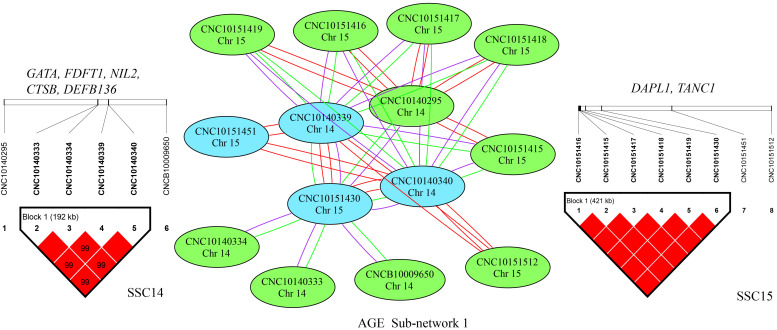
Figure 4.
Epistatic sub-network 1 among SNPs affecting AGE and the related LD information. The color of a node represents the p-value of an interaction (p < 1 × 10−12 = red; p < 1 × 10−11 = blue; p < 1 × 10−10 = green). The color of the connecting lines between circles indicates the type of epistatic effect (A × A = red; A × D = purple; D × D = green). The genes located in the LD regions are listed.

