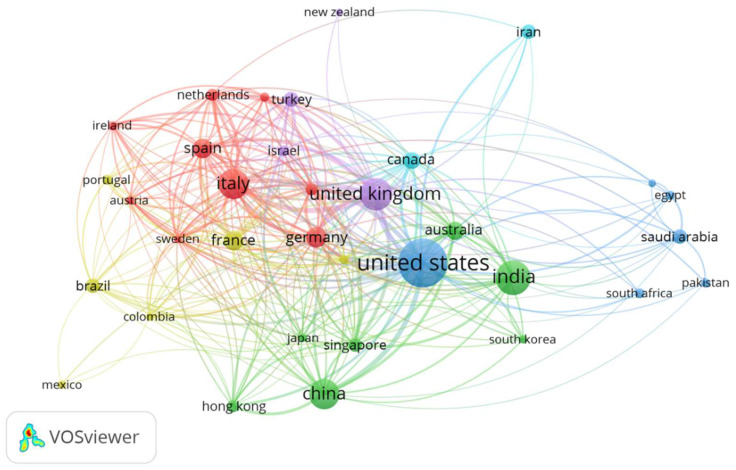
Figure 2.
Network visualization map of international collaboration among countries with a minimum productivity of 15 documents. The thickness of the connecting line between two countries shows the strength of collaboration. Countries with a similar color form one cluster. For example, the countries in red, such as Germany, Spain and Italy, are found in one cluster with the highest collaboration in this cluster.

