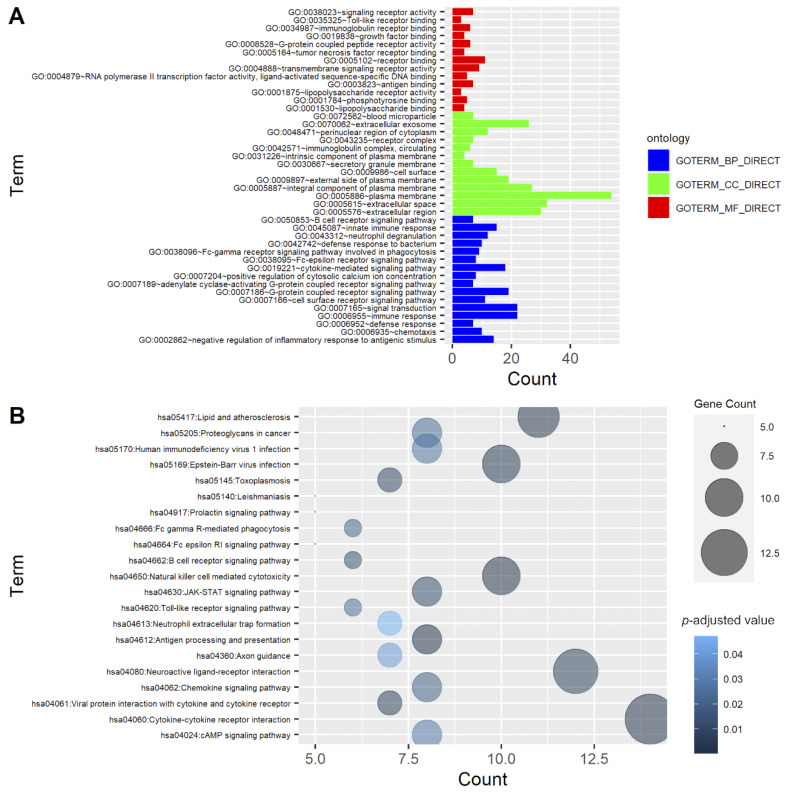
Figure 4.
Functional enrichment analysis of 106 immune-related differentially expressed genes (IR-DEGs). (A) Gene Ontology (GO). The bar plot shows the top 50 enriched IR-DEGs from GO analysis. Blue, green, and red represent biological process (BP), cellular component (CC), and molecular function (MF) GO terms, respectively. (B) Kyoto Encyclopedia of Genes and Genomes (KEGG) pathway. Different colors and sizes of bubbles represent different p values and gene counts of a pathway.

