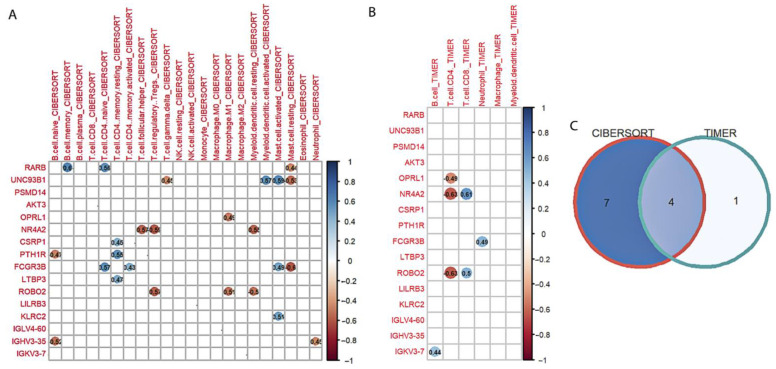
Figure 7.
Identification of candidate genes. (A) Correlation between 16 hub genes and CIBERSORT immune cell types. (B) Correlation between 16 hub genes and TIMER immune cell types. (C) Venn diagram of overlap genes. Red and blue circles represent the significant negative and positive correlation, respectively. (NK.cell, natural killer cell).

