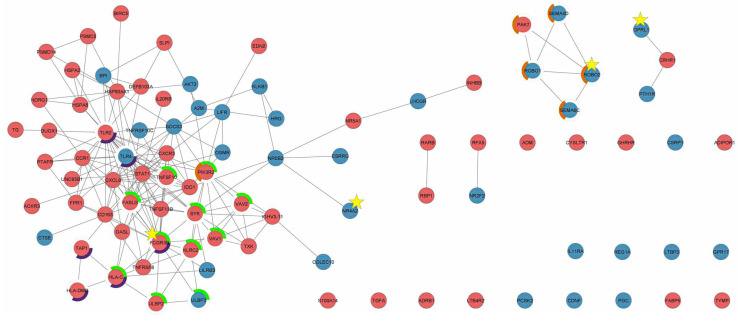
Figure 8.
Protein–protein interaction network of 106 immune-related differentially expressed genes. “Red” and “blue” represent the upregulated and downregulated genes, respectively. The gray lines (edges) indicate interactions between connected nodes. Star highlights the candidate gene. The green, purple, and orange circles represent the natural-killer-cell-mediated cytotoxicity, phagosome, and axon guidance pathway, respectively.

