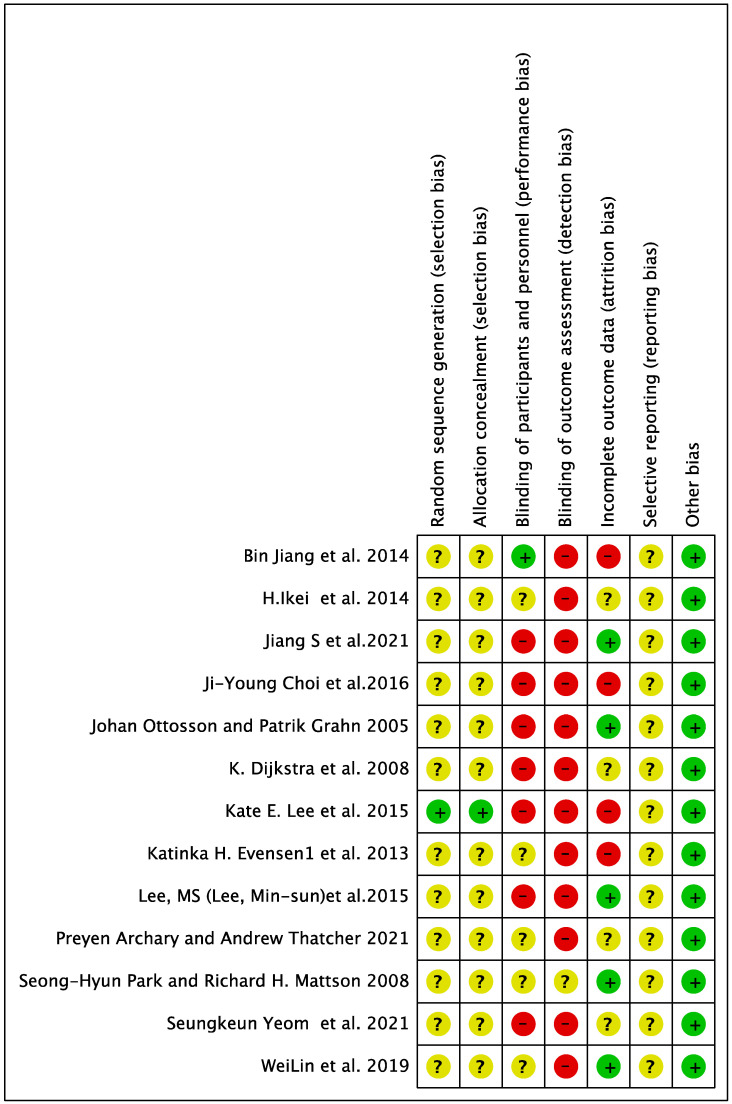
Figure A1.
Risk of Bias table for included RCT studies. Bin Jiang et al., (2014) [5], H. Ikei et al., (2014) [40], Jiang S. et al., (2021) [45], Ji-Young Choi et al., (2016) [50], Johan Ottosson and Patrik Grahn (2005) [38], K. Dijkstra et al., (2008) [36], Kate E. Lee et al., (2015) [35], Katinka H. Evensen1 et al., (2013) [42], Lee, MS (Lee, Min-sun) et al., (2015) [46], Preyen Archary and Andrew Thatcher (2021) [41], Seong-Hyun Park and Richard H. Mattson (2008) [48], Seungkeun Yeom et al., (2021) [16], WeiLin et al., (2019) [12].

