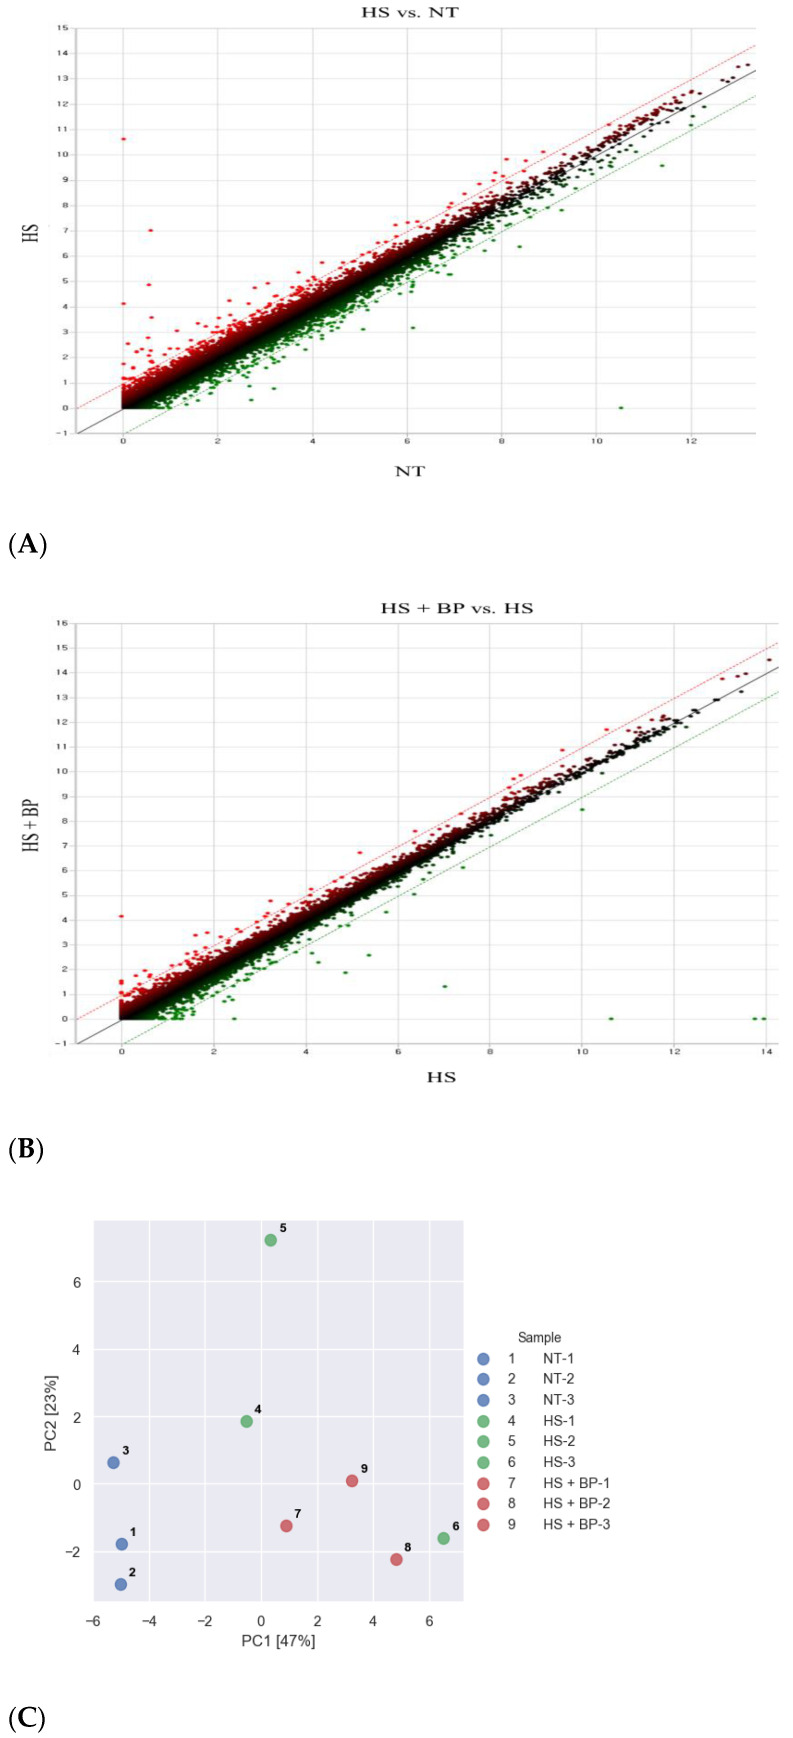
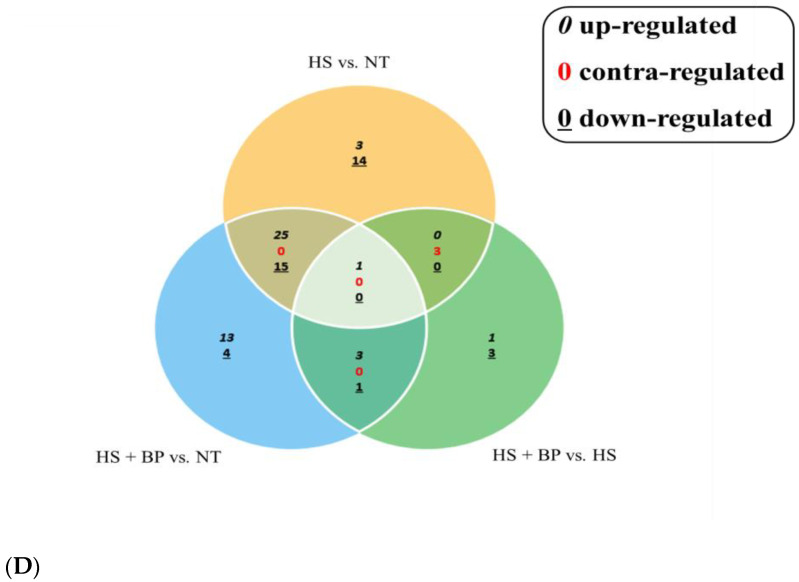
Figure 1.
Summary of the DEGs (DEG; p < 0.05, ≥2-fold change) in the porcine jejunum under HS and fed dietary BP: (A) Scatter plot in HS vs. NT; (B) Scatter plot in HS + BP vs. HS; (C) PCA analysis based on DEGs of the NT, HS, and HS + BP groups; (D) Venn diagrams indicating DEGs; NT, normal temperature; HS, heat stress; HS + BP, dietary beet pulp under heat stress.


