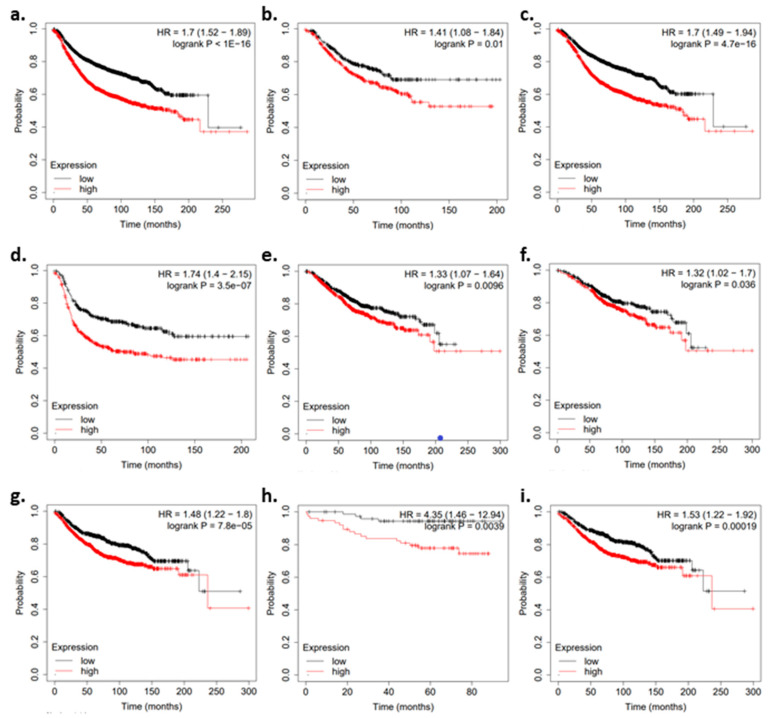
Figure 5.
Kaplan–Meier plots for patient prognosis when divided by ACBD3 mRNA expression. Black data points represent patients whose breast tumors had ACBD3 mRNA expression below the median level. Red data points represent patients whose breast tumors had ACBD3 mRNA expression above the median level. (a–d) Relapse-free survival when ACBD3 is high or low for (a) breast cancer patient cohort overall, (b) HER2− breast cancer patients, (c) ER+ breast cancer patients, (d) ER−breast cancer patients. (e,f) Overall survival when tumor ACBD3 is high or low for (e) the breast cancer patient cohort overall, (f) ER+ breast cancer patients. (g–i) Overall distant metastasis-free survival when tumor ACBD3 was high or low for (g) the breast cancer patient cohort overall, (h) HER2− breast cancer patients, (i) ER+ breast cancer patients.

