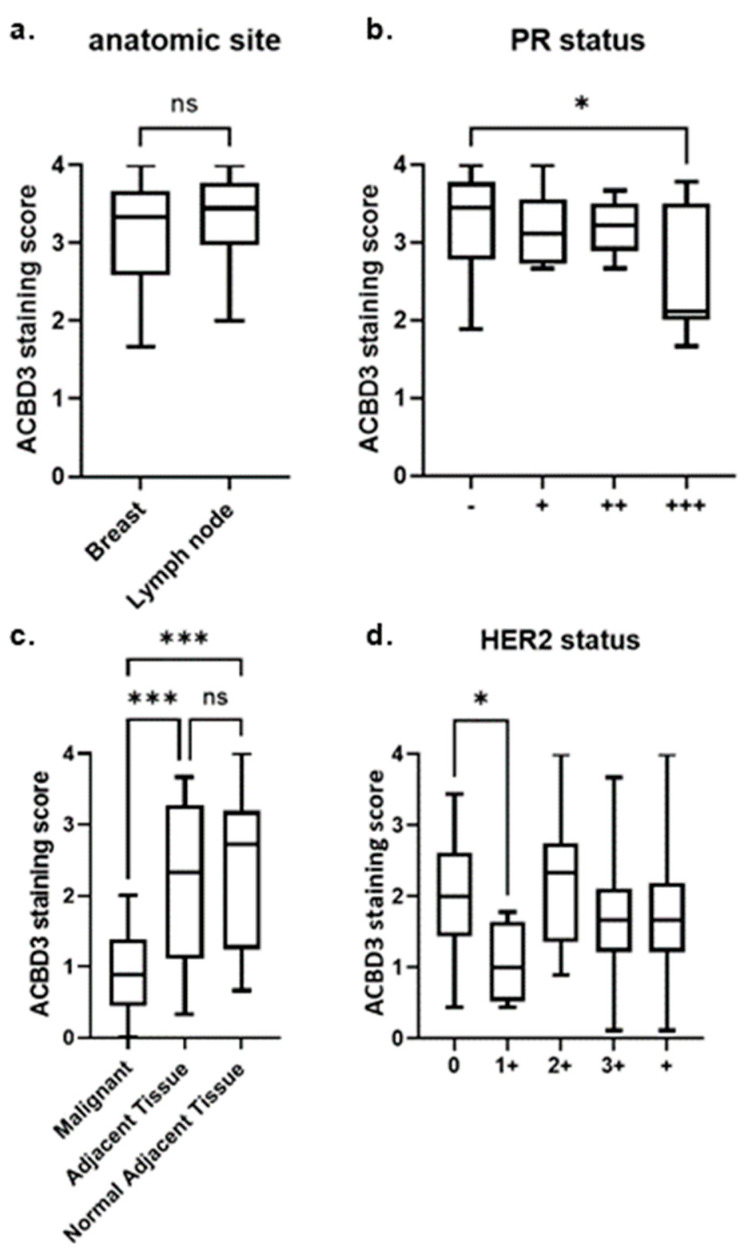
Figure 8.
ACBD3 staining score of US BIOMAX fixed breast tissue core arrays. (a) Array BR1008B, there was no statistical difference in ACBD3 staining between malignant breast tissue (n = 48) and metastatic breast cancer of the lymph node (n = 38). (b) Array BR1008B, ACBD3 protein expression was significantly higher in PR negative breast cancer cores (n = 50) compared to PR 3+ cores (n = 9) (malignant breast tissue and metastatic lymph tissue, * p = 0.02202), but there was no statistical difference between PR− samples compared to all grades of PR+ core (not shown). (c) Array BC08032a, ACBD3 protein levels are significantly lower in malignant tissue compared to either cancer-adjacent tissue or normal-adjacent tissue, *** p < 0.001; ns = not significant (d) Array BR1401, there was a statistically significant difference between HER2− (grade 0) breast cancer samples and HER 1+ samples, * p = 0.0107. Error bars represent the standard deviation.

