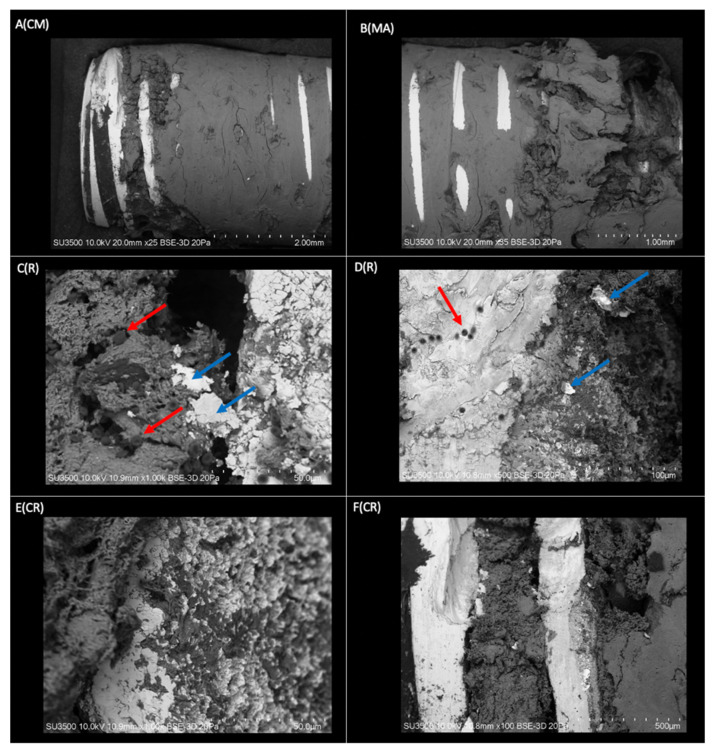
Figure 2.
Three-dimensional structure of the implant sample covered with bone tissue obtained by VP-SEM. A(CM) Coronal area-middle of the implant. The bone tissue homogeneously covers most of the implant. Smooth surface in conformation to bone laminar zones (Mag: ×25). B(MA) Mid-apical area of the dental implant. Morphologically rougher and more sinuous tissue in the apical sector compared to the middle zone (Mag: ×35). C(R) Thread on the right side of the image and groove on the left side of the image, covered by mineralized and non-mineralized cancellous bone tissue with associated red blood cells (red arrows) and flaking of the implant surface (blue arrow) (Mag: ×1000). D(R) Implant thread (light grey) with fully associated bone tissue (dark grey) and presence of red blood cells (red arrow). Spalling of the dental implant surface (blue arrow) (Mag: ×500). E(CR) View of an implant thread at higher magnification (light gray area). Integration of bone tissue (dark gray area) in the irregularities on the implant surface (Mag: ×1000). F(CR) Implant threads without bone tissue and grooves completely covered by bone tissue (Mag: ×100).

