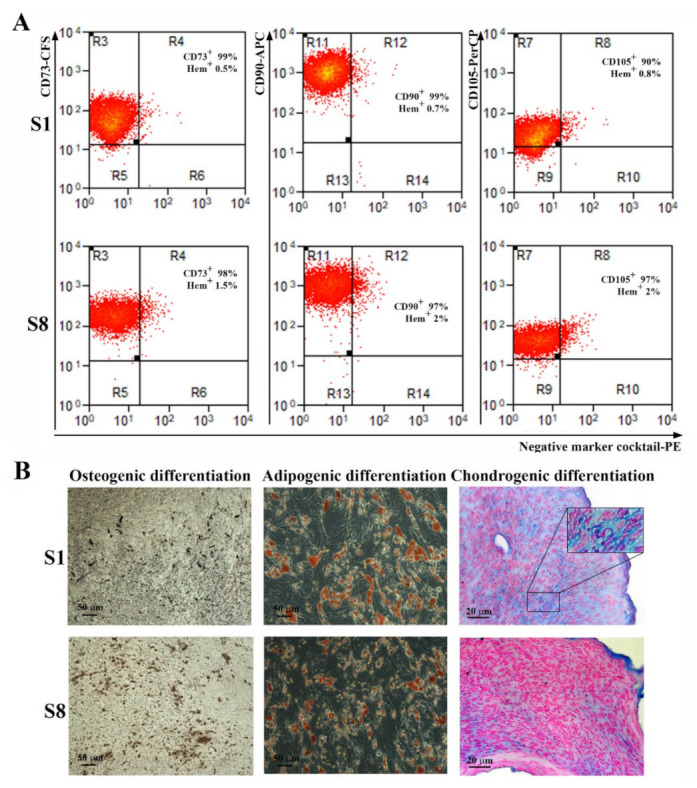
Figure 4.

Analysis of surface markers expression and multilineage differentiation capacity of hTERT-transduced ADSC-derived sub-populations. (A) Flow cytometry histograms showing the expression of specific surface markers for MSC on sub-populations S1 and S8-ADSC at 5 passages after transduction. It can be noticed that the high expression for CD73, CD90, and CD105 and the absence of hematopoietic markers CD45, CD34, CD11b, CD79A, and HLA-DR were preserved after lentiviral transduction. (B) Analysis of the multipotent capacity of hTERT ADSC-derived sub-populations S1 and S8-ADSC by their ability to generate osteocytes (left, von Kossa staining), adipocytes (middle, Oil Red O staining), and chondrocytes (right, Alcian blue staining) when cultured in specific conditions. The insert in the picture of chondrogenic differentiation of S1 sub-population depicts the lacunae-containing chondrocytes.
