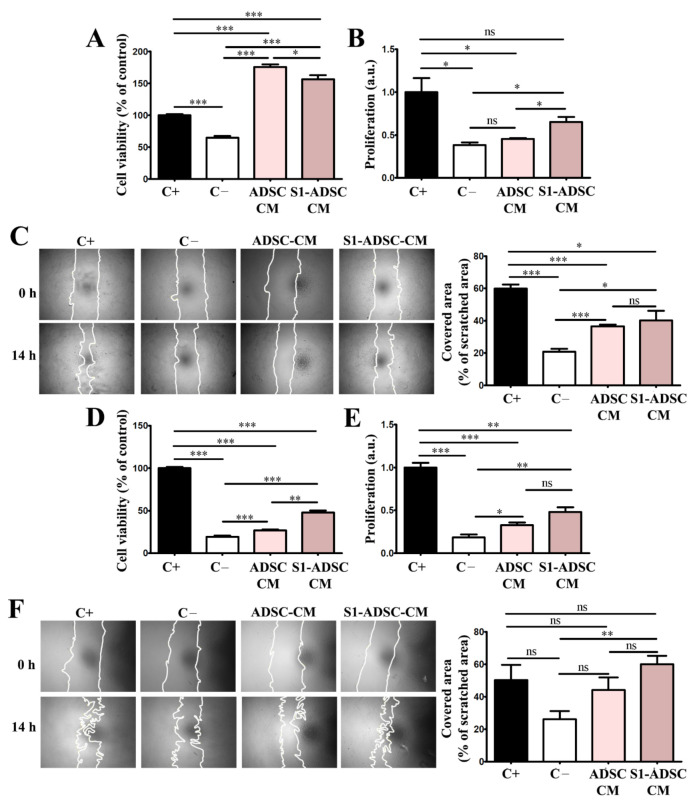
Figure 5.
Assessment of the cell viability, proliferation and migration induced by hTERT S1-ADSC-CM on keratinocytes and hDF. (A) XTT assay showing the viability of keratinocytes cultured for 5 days in the presence of hTERT S1-ADSC-CM versus ADSC-CM; (B) Assessment of the capacity of hTERT S1-ADSC-CM versus ADSC-CM to promote keratinocyte proliferation as revealed by DNA quantification; (C) Keratinocyte migration assessed by Scratch test: (left) phase-contrast microscopy showing the scratched area at t = 0 h and 14 h later and (right) the quantification of covered area as a percentage of the initial scratched area. (D) XTT assay showing the viability of fibroblasts cultured for 5 days in the presence of hTERT S1-ADSC-CM versus ADSC-CM; (E) Assessment of the capacity of hTERT S1-ADSC-CM versus ADSC-CM to promote fibroblast proliferation as shown by DNA quantification; (F) Fibroblast migration assessed by Scratch test: (left) phase-contrast microscopy showing the scratched area at t = 0 h and 14 h later and (right) the quantification of covered area as a percentage of the initial scratched area. Data are means ± SD (n = 3, *** p < 0.001; ** p < 0.01; * p < 0.05; ns p ≥ 0.05, not significant).

