Figure 6.
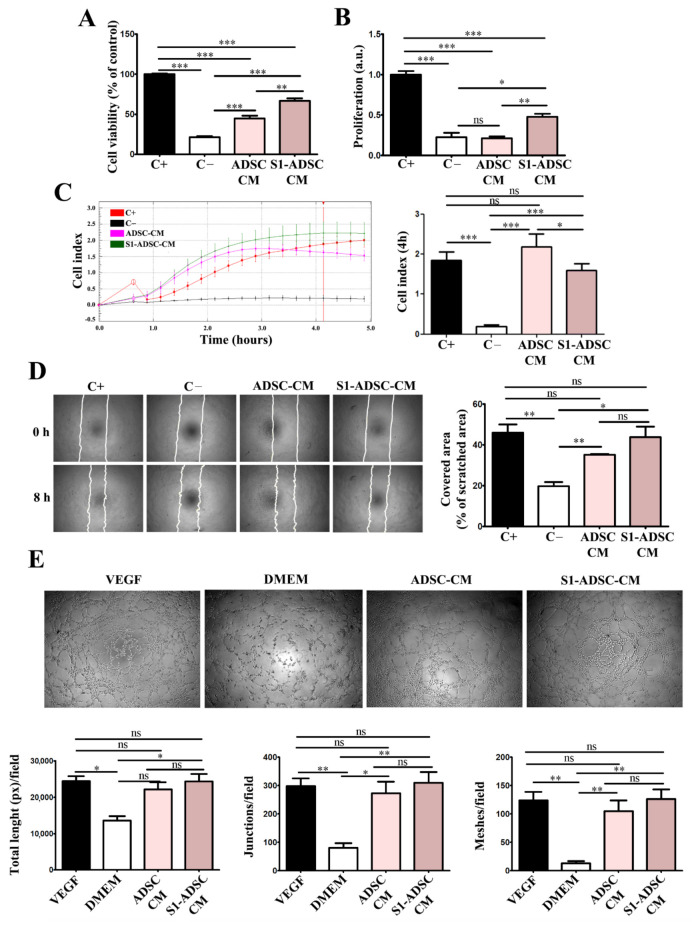
Assessment of pro-angiogenic effect of hTERT S1-ADSC-CM versus ADSC-CM on human EC. (A) Viability of EC cultured for 5 days in the presence of hTERT S1-ADSC-CM versus ADSC-CM as revealed by XTT assay; (B) Assessment of hTERT S1-ADSC-CM versus ADSC-CM potential to promote EC proliferation as revealed by DNA quantification; (C) Time-dependent chemotactic migration of EC. The diagram on the right illustrates the EC migration index at 4 h under the influence of S1-ADSC-CM versus ADSC-CM. (D) Evaluation of hTERT S1-ADSC-CM to induce EC migration by Scratch test: (left) phase-contrast microscopy showing the scratched area at t = 0 h and 8 h later and (right) the quantification of covered area as a percentage of the initial scratched area. (E) Phase-contrast microscopy showing the angiogenic effect of S1-ADSC-CM versus ADSC-CM on EC using a tube formation assay. The analysis of in vitro tube-like structures by quantification of total tube length (left), junctions (middle), and meshes (right) is presented below. The diagrams show the mean values of one representative experiment performed in triplicates. Data are means ± SD (n = 3, *** p < 0.001; ** p < 0.01; * p < 0.05; ns p ≥ 0.05, not significant).

