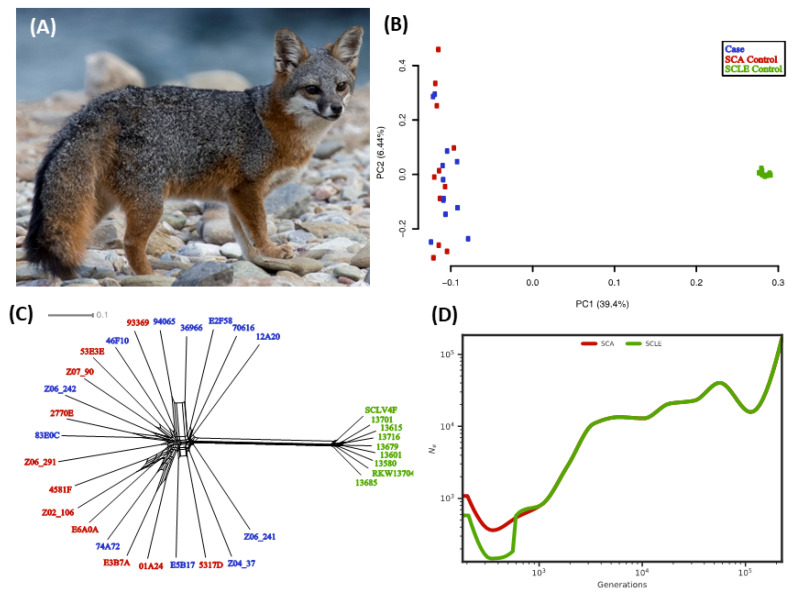
Figure 1.
Catalina Island fox demographics. (A) Healthy island fox (photo credit Jaymi Heimbuch). Patterns of differentiation and divergence between populations using (B) PCA, and (C) Neighbor-net analysis. Case individuals are shown in blue, Santa Catalina Island (SCA) controls in red, and San Clemente Island (SCLE) controls in green. (D) Effective population size (Ne) over time calculated from single nucleotide variant (SNV) genotypes within neutral regions. A 2 year generation time and a mutation rate of 2.0 × 10⁻⁸/site/generation were assumed [2]. SCA individuals are shown in red and SCLE individuals in green.

