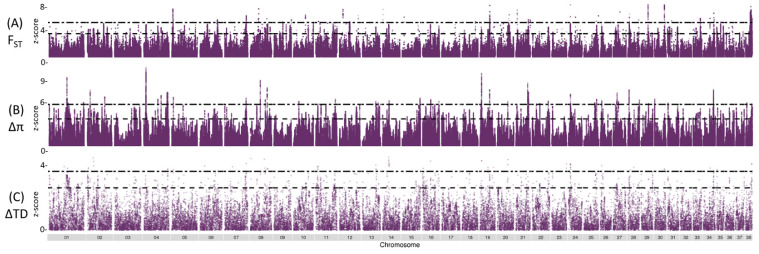
Figure 2.
Genome-wide allele frequency SCA case (n = 12) and SCA control (n = 11) individuals from overlapping 50 Kb windows in 1 Kb steps. (A) Manhattan plot of z-transformed FST values. Dashed line indicated top 1% (z-score = 3.48). Double dashed line indicated top 0.1% (z-score of 5.41). (B) Distribution plots of ∆π values. Dashed line indicated top 1% (z-score = 3.77). Double dashed line indicated top 0.1% (z-score of 5.81) (C) Distribution plots of ∆Tajima’s D values. Dashed line indicated top 1% (z-score = 2.64). Double dashed line indicated top 0.1% (z-score of 3.67).

