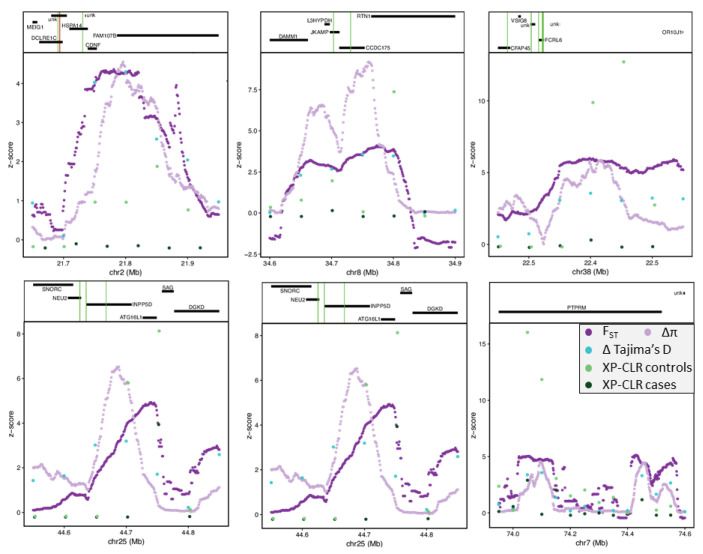
Figure 3.
Z−transformed selection scan statistics (bottom) and gene annotations (top) plotted across the top 16 ranked candidate regions highly differentiated between case and SCA controls. FST (purple), ∆π (lavender), ∆Tajima’s D (turquoise), and XP-CLR (CO: control (light green); CA: case (dark green)). Gene annotation show genes as black horizontal bars with missense mutations as green vertical lines and stop-gained mutations as red vertical lines.

