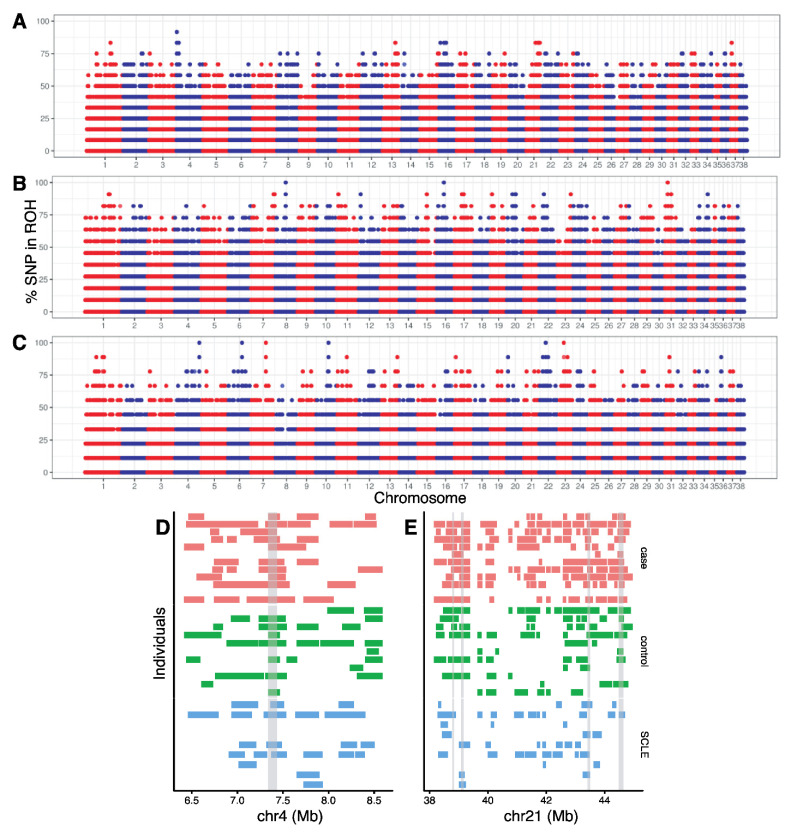
Figure 4.
Manhattan plot of the proportion of times each SNV falls within a ROH in the (A) cases, (B) SCA controls and (C) SCLE controls. Chromosomes 1–38 are arranged left to right, with alternating red and blue representing different chromosomes. (D) ROH detected in each individual on a part of chromosome 4 and (E) chromosome 21. Gray bars represent regions where 75% of cases (shown in salmon) have overlapping ROH and less than 75% of SCA controls (shown in green) and SCLE controls (shown in light blue). See Supplemental Information for genome-wide ROH for each individual.

