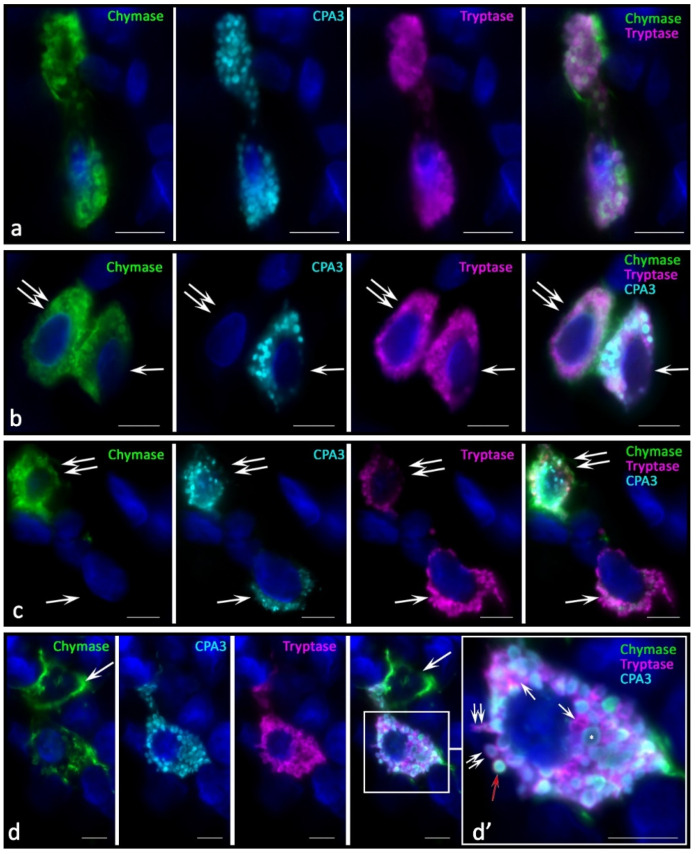
Figure 2.
Phenotypes of specific proteases of MCs in the tumor microenvironment in melanoma. (a) Interaction of two MCs containing tryptase, chymase, and CPA3. (b) MC contacting with the triad of specific proteases expression (indicated by an arrow) with a CPA3-negative mast cell (indicated by a double arrow). (c) Chymase-negative MCs (indicated by an arrow) are co-localized within the limits of paracrine influence with MCs, which express a triad of specific proteases (indicated by a double arrow). (d) Chymase-positive MC contacting (indicated by an arrow) with a MC expressing tryptase, chymase, and CPA3. (d’) Fragment of the photo in (d). Granules with different content of specific proteases are visualized, including granules with the phenotype Tr−Ch−CPA3+ (indicated by an asterisk), Tr+Ch−CPA3− (indicated by an arrow). Selective secretion of a dyad (“tryptase-CPA3”, double arrow) and a triad (red arrow) of specific proteases is detected simultaneously. Scale bar: 1 µm (d’), 5 µm (the rest).

