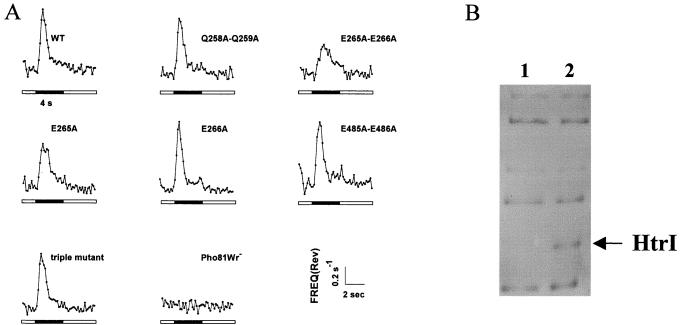
FIG. 4.
(A) Reversal frequency responses to photostimuli. Phototaxis responses of wild-type cells and HtrI mutants in response to a 4-s step down (dark bar under each graph) in orange (600-nm) light. Stimuli were delivered at 26-s intervals and three or more sets of 16 stimuli each were averaged to produce the final data. (B) Autofluorograms of l-[methyl-3H]methionine labeled membrane proteins. Lane 1, Pho81Wr−/pKJ306E265A; lane 2, Pho81Wr−/pKJ306E266A.

