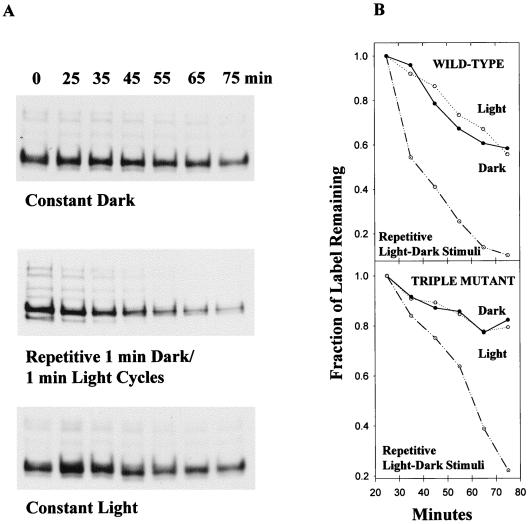
FIG. 6.
Pulse-chase experiment with l-[methyl3H]methionine-labeled Pho81Wr−/pKJ306WT and triple mutant cells. (A) Autofluorogram. Radioactivity was chased by adding a 10× excess of nonradioactive l-methionine to cells labeled in vivo as described in Materials and Methods. Wild-type cells were exposed to the dark, to the light, and to alternating light and dark as described in Materials and Methods, and acetone-precipitated samples from each time point were processed for SDS-PAGE. (B) Amount of labeling corresponding to the HtrI band was quantified by using SigmaScan for each condition used. For the triple mutant, the amount of labeling corresponding to the second band from the top (Fig. 3) was plotted. The values at 25 min were maximal and were therefore defined as 100% labeling.

