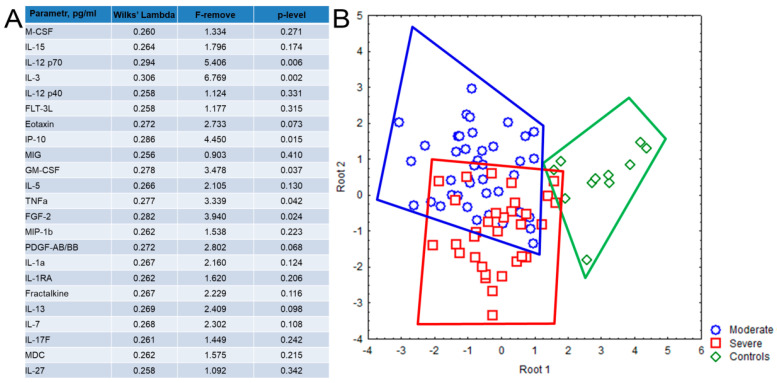
Figure 2.
Discriminant analysis based on the cytokine levels in plasma samples, obtained from patients with COVID-19 and healthy donors, consisted of 23 steps and 23 variants in the model with Wilks’ lambda = 0.249, approx. F (46.118) = 2.572, p < 0.001. (A) The list of 23 cytokines with high grouping and discriminant value included in the model. (B) Dot plot shows the clusters formed by the patients with moderate (blue color) and severe (red color) disease and healthy donors (green color). Each dot represents one person.

