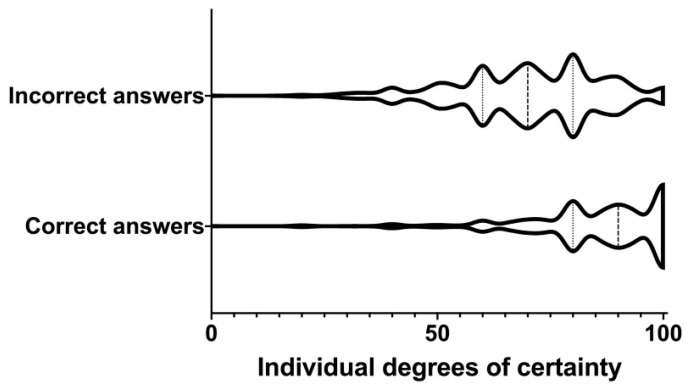
Figure 3.
Violin plots of individual levels of certainty for correct and incorrect answers. The dashed lines show the medians and the dotted lines the lower and upper quartiles. Although the levels of confidence appear high for incorrect answers, they are significantly higher for correct answers (p < 0.0001).

