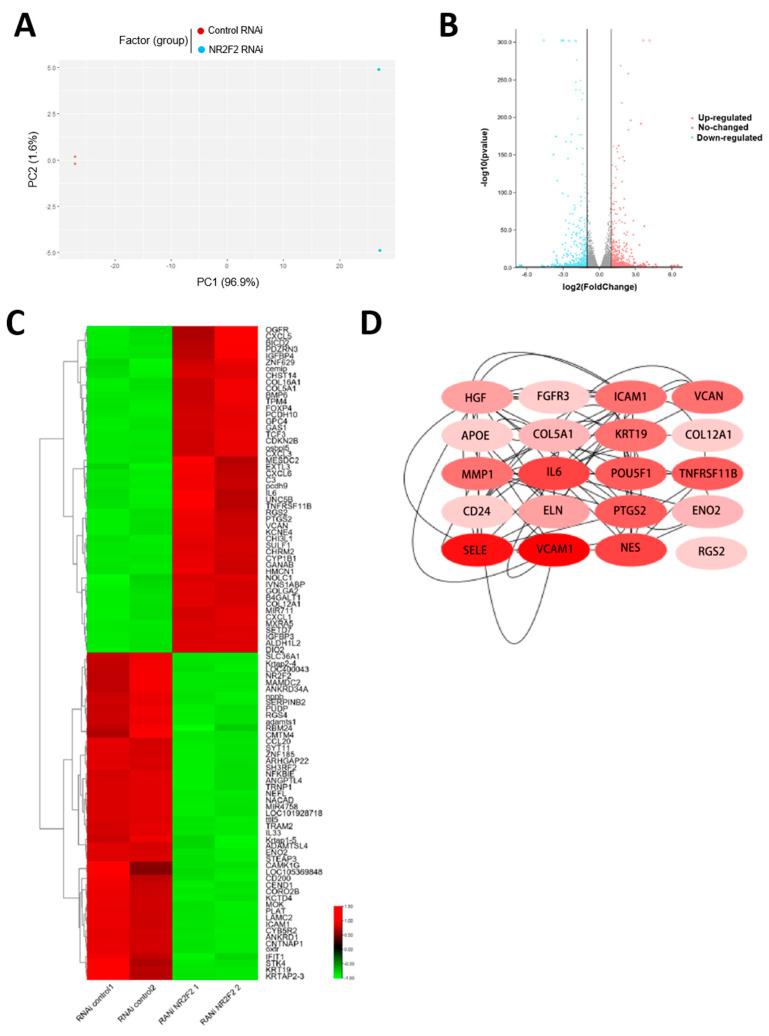
Figure 2.
Global gene expression changes upon NR2F2 knockdown in WJ-MSCs. (A) WJ-MSCs exhibited two distinct gene expression patterns after NR2F2 was knocked down. (B) Each point in the volcano plot represents a gene. Red dots indicate significantly up-regulated genes, blue dots indicate significantly down-regulated genes, and grey dots indicate non-differentially expressed genes. (C) Heatmap showing the top 50 genes with the most significant up- and down-regulation, with red for up-regulation and green for down-regulation. (D) The darker the red of the Hub gene, the higher the score.

