Figure 5.
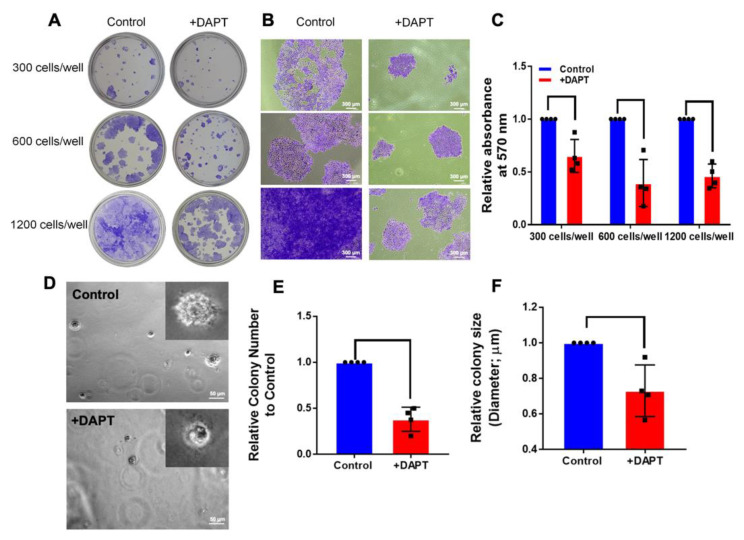
Notch signaling inhibitors inhibited colony formation in both an anchorage-dependent and anchorage-independent manner. Cells were grown in 24-well plates with various cell numbers and treated with DAPT for 14 days (n = 4). The colonies were stained using 0.1% crystal violet. (A) The overall field of colonies was taken by a digital camera. (B) Colony sizes were observed using a microscope. (C) The staining was solubilised, and the absorbance was measured at 570 nm. For anchorage-independent growth, HSC-4 cells were plated into soft agar on 24-well plates and cultured with 0.5% DMSO (Control) or 50 µM DAPT. After 14 days, the colonies were observed and photographed using a microscope. (D) The images show overall cell growth and sizes between cells treated with DMSO and DAPT. (E,F) Quantitative analysis identifies the size and number of colonies. Bars indicate a significant difference between groups (p < 0.05).

